


Similar Questions
Explore conceptually related problems
Recommended Questions
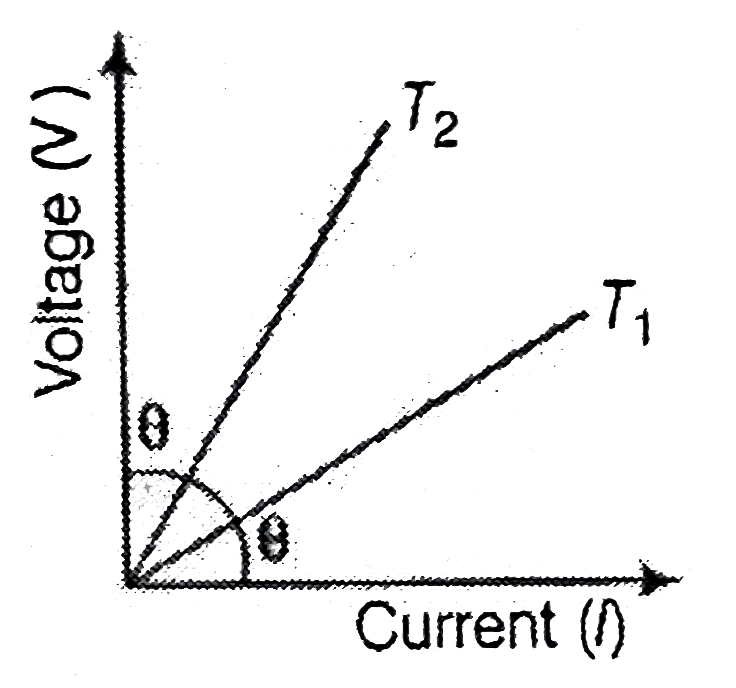
- The V-l graph for a conductor at temperatures T(1) " and " T(2) are as...
Text Solution
|
- The figure shows the variation of V with i at temperatures T(1) and T(...
Text Solution
|
- The voltage V and current I graph for a conductor at two different tem...
Text Solution
|
- The V - i graph for a conductor at temperature T(1) and T(2) are as sh...
Text Solution
|
- The V-l graph for a conductor at temperatures T(1) " and " T(2) are as...
Text Solution
|
- The voltage V and current I v graphs for a conductor at two different ...
Text Solution
|
- The stress-strain graph for a metallic wire is shown at two different ...
Text Solution
|
- चित्र में विभवांतर V और धारा I के बीच किसी चालक के दो ताप T(1)और ...
Text Solution
|
- The current-voltage graph for a given metallic conductor at two differ...
Text Solution
|