Text Solution
Verified by Experts


Similar Questions
Explore conceptually related problems
Recommended Questions
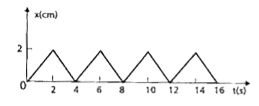
- Figure shows the position - time graph of a body of mass 0.04 kg . S...
Text Solution
|
- The figure shows the position-time (x-t) graph of one-dimensional moti...
Text Solution
|
- Figure shows the position-time graph of a particle of mass 0.04kg. Sug...
Text Solution
|
- Shows the position time graph of a particle of mass 0.04 kg Suggest a ...
Text Solution
|
- चित्र में 0.04 kg सहती के किसी पिंड का स्थिति - समय ग्राफ दर्शाया जय...
Text Solution
|
- The figure shows the position – time (x – t) graph of one – dimensiona...
Text Solution
|
- The position-time graph of a body of mass 0.04kg is shown in the figur...
Text Solution
|
- Figure shows the position-time graph of a body of mass 0.04 kg. Sugg...
Text Solution
|
- Figure shows the position-time graph of a body of mass 0.04 kg. Sugg...
Text Solution
|