Text Solution
Verified by Experts


Similar Questions
Explore conceptually related problems
Recommended Questions
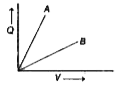
- The given graph shows the variation of charge Q versus potential diffe...
Text Solution
|
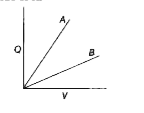
- Shows these variation of charge q for two capacitors C(1) and C(2) The...
Text Solution
|
- In fig. C(1) = 20 muF, C(2) = 30 muF and C(3) = 15 muF and the insulat...
Text Solution
|
- The given graph in Fig. shows the variation of charge q versus potenti...
Text Solution
|
- Consider three capacitors of capacitance C(1),C(2) and C(3) . If C(1),...
Text Solution
|
- The capacities of two parallel plate capacitors are C(1) and C(2) and ...
Text Solution
|
- Two identical capacitor C(1) and C(2) are connected in series with a b...
Text Solution
|
- A capacitor of capacity C(1) = 1 muF is charged to a potential of 100 ...
Text Solution
|
- C(1) और C(2) धारिता के दो संधारित्र समान्तर क्रम में जोड़े गये है | ...
Text Solution
|