


Topper's Solved these Questions
QUESTION PAPER -1
KUMAR PRAKASHAN|Exercise SECTION D ( Answer the following as required with calculations) |1 VideosQUESTION PAPER -1
KUMAR PRAKASHAN|Exercise SECTION B( Answer the following briefly with calculations )|14 VideosQUADRATIC EQUATIONS
KUMAR PRAKASHAN|Exercise Test Your Skills|19 VideosQUESTION PAPER-2
KUMAR PRAKASHAN|Exercise Section C|14 Videos
Similar Questions
Explore conceptually related problems
KUMAR PRAKASHAN-QUESTION PAPER -1-SECTION C( Answer the following as required with calculations :)
- On dividing x^(3)-3x^(2)+x+2 by a polynomial g(x), the quotient and re...
Text Solution
|
- Find the roots of the equation 1/(x+4)-1/(x-7)=11/30, x != -4, 7.
Text Solution
|
- Which term of the AP 21, 18, 15,.. Is -81? Also, is any term 0? Give r...
Text Solution
|
- For an AP, if a(n)=4, d=2 and S(n)= -14, find n and a.
Text Solution
|
- In what ratio does the point (-4, 6) divide the line segment joining t...
Text Solution
|
- The distribution below gives the weights of 30 students of a class. ...
Text Solution
|
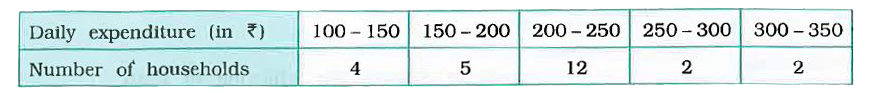
- The table below shows the daily expenditure on food of 25 households i...
Text Solution
|
- Prove that the lengths of tangents drawn from an external point to a ...
Text Solution
|
- In the given figure, a square OABC is inscribed in a quadrant OPBQ. If...
Text Solution
|
- From a solid cylinder whose height is 2.4 cm and diameter 1.4 cm, a co...
Text Solution
|
- Metallic spheres of radii 6 cm, 8 cm, and 10 cm respectively, are melt...
Text Solution
|