Text Solution
Verified by Experts
The correct Answer is:


Similar Questions
Explore conceptually related problems
Recommended Questions
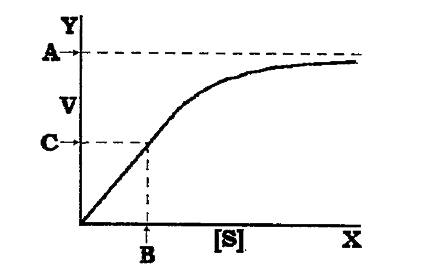
- The adjoining graph shows change in conc. of substrate on enzyme activ...
Text Solution
|
- The given adjacent graph depicts the change in conc. of substrate on e...
Text Solution
|
- Assertion : Specific substrate binds at the active site of the ...
Text Solution
|
- Following graphs show the effect of change in concentration of substra...
Text Solution
|
- The following graph represents enzyme activity with changing
Text Solution
|
- What is denoted by X and Y in the given graph? {:("X","Y"),("1) ...
Text Solution
|
- Prepare a graph showing the action of temperature on enzyme activity
Text Solution
|
- Observe the given graph a and b. Does the substrate concentration infl...
Text Solution
|
- Observe the graph showing the activity of an enzyme influenced by pH. ...
Text Solution
|