A
B
C
D
Text Solution
Verified by Experts
The correct Answer is:


Similar Questions
Explore conceptually related problems
Recommended Questions
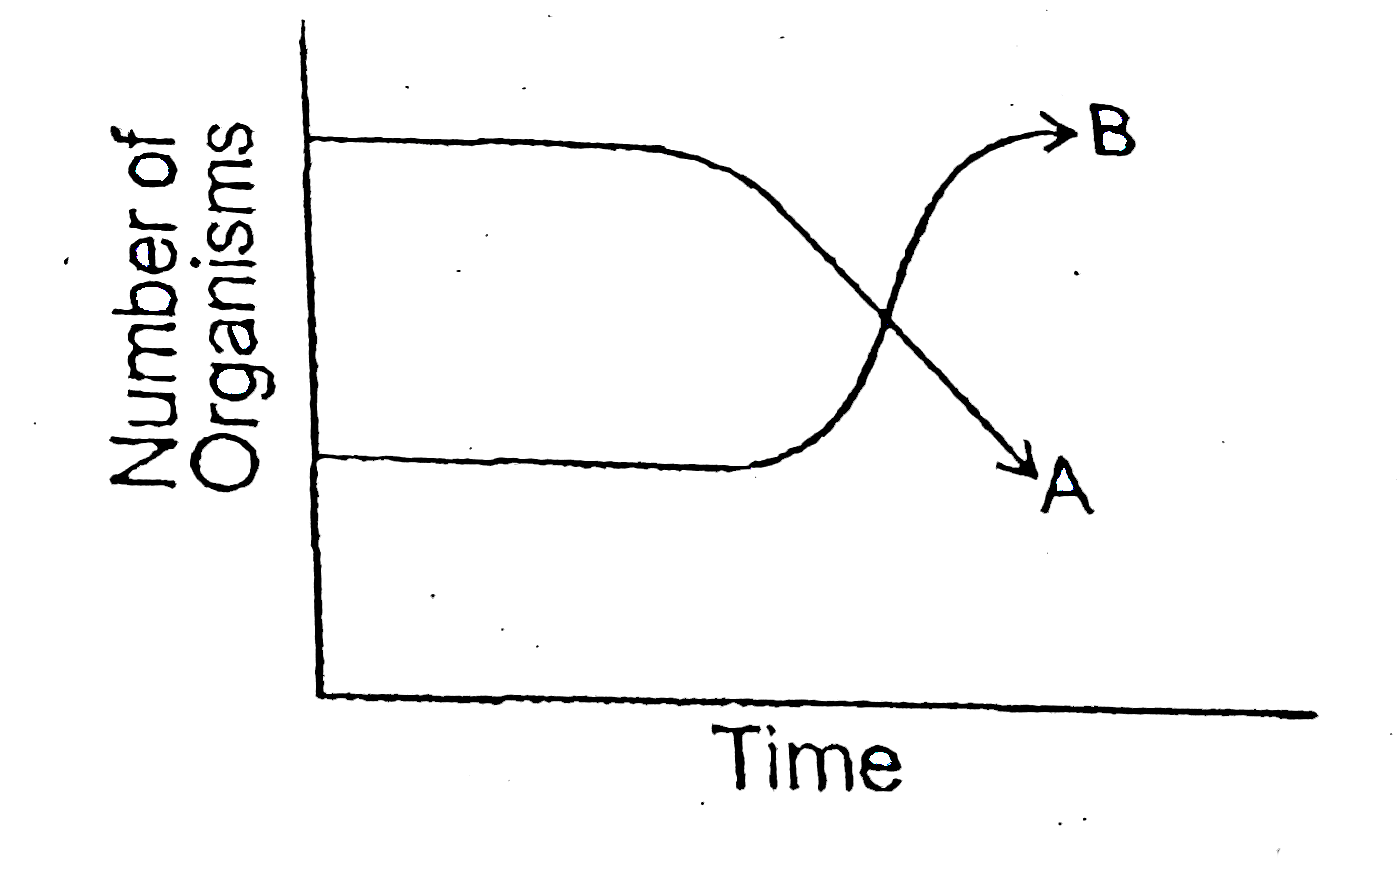
- The following graph depicts changes in two populations (A and B) of he...
Text Solution
|
- The given adjacent graph depicts the change in conc. of substrate on e...
Text Solution
|
- The state of an ideal gas was changed isobarically. The graph depicts ...
Text Solution
|
- The following graphs (A and B) depicts changes in DNA Content during c...
Text Solution
|
- The graph below shows the changes in two populations of herbivores in ...
Text Solution
|
- दिए गए ग्राफ (a) व (b) में आवृत्ति के सापेक्ष परिपथ की धारा के विरोध क...
Text Solution
|
- किन कारणों से आबादी सदा परिवर्तनशील होती है?
Text Solution
|
- The graph above shows how the size of a country's population has chang...
Text Solution
|
- Which of the following graphs best depicts the changes in one cycle of...
Text Solution
|