Home
Class 12
PHYSICS
If AB is an isothermal BC is an isochor...

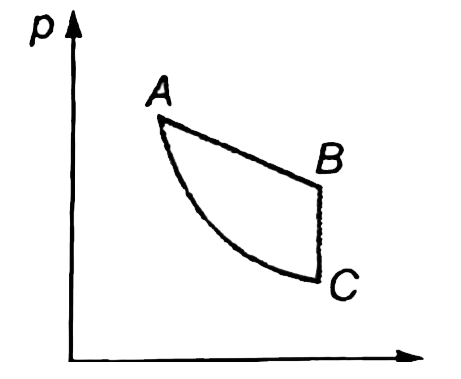
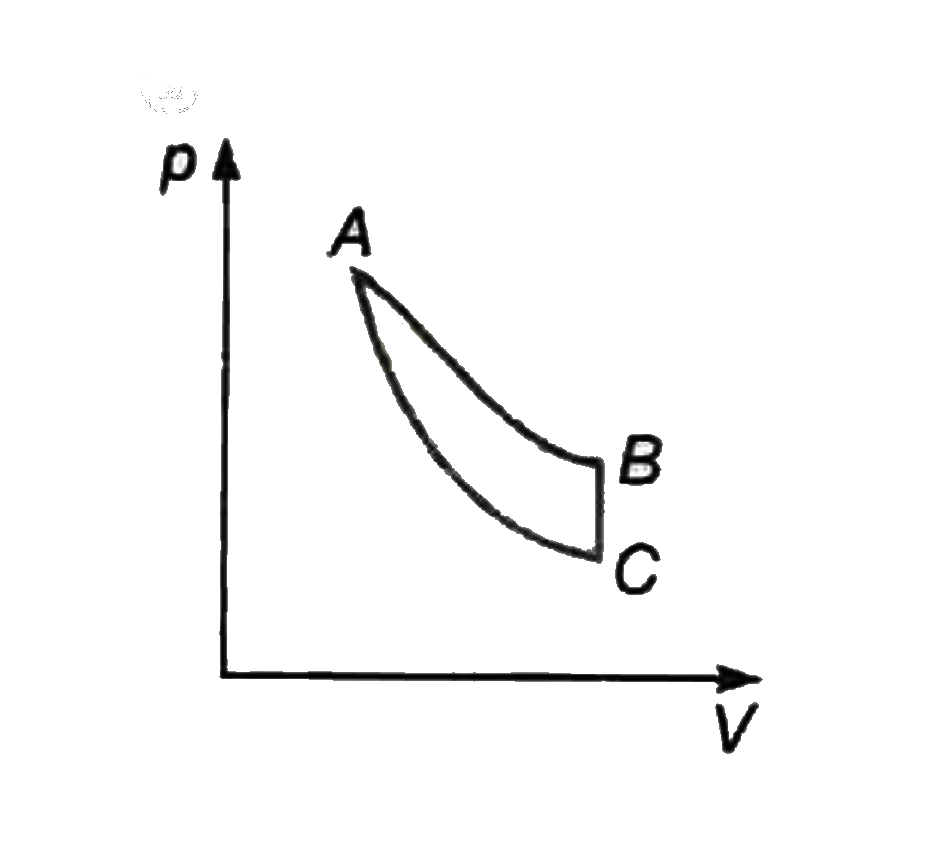
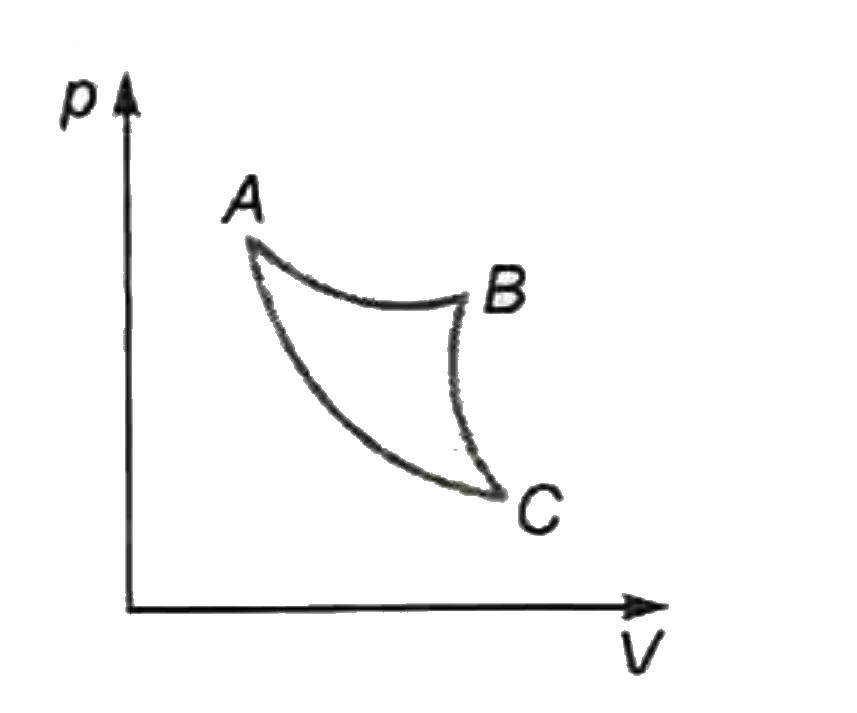
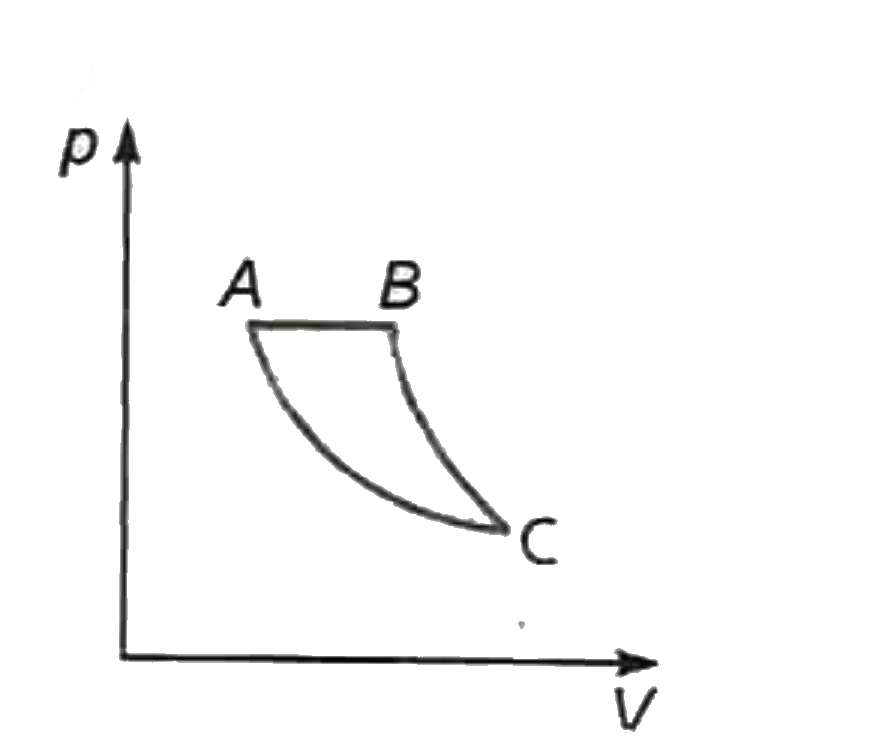
If AB is an isothermal BC is an isochoric and AC is an adiabatic, which of the graphs correctly represents given in figure.

A

B

C

D

Text Solution

AI Generated Solution

The correct Answer is:
To solve the problem, we need to analyze the characteristics of the different thermodynamic processes mentioned: isothermal, isochoric, and adiabatic. Let's break down the solution step by step. ### Step 1: Understand the Processes 1. **Isothermal Process (AB)**: This process occurs at a constant temperature. For an ideal gas, the relationship between pressure (P) and volume (V) is given by \( PV = nRT \). The graph of an isothermal process is a hyperbola in the PV diagram, and it has a gentle slope. 2. **Isochoric Process (BC)**: This process occurs at a constant volume. In a PV diagram, this is represented as a vertical line since the volume does not change, and pressure can vary with temperature. 3. **Adiabatic Process (AC)**: This process occurs without heat exchange with the surroundings. For an ideal gas, the relationship is given by \( PV^\gamma = \text{constant} \), where \( \gamma \) is the heat capacity ratio. The slope of an adiabatic process is steeper than that of an isothermal process in the PV diagram. ### Step 2: Analyze the Graphs - **Graph AB (Isothermal)**: Should be a hyperbolic curve that slopes gently downwards. - **Graph BC (Isochoric)**: Should be a vertical line since volume is constant. - **Graph AC (Adiabatic)**: Should be a curve that slopes downwards but is steeper than the isothermal curve. ### Step 3: Compare the Slopes - The slope of the adiabatic process (AC) is steeper than that of the isothermal process (AB). - The isochoric process (BC) is a vertical line, indicating no change in volume. ### Step 4: Identify the Correct Graph From the analysis, we can conclude that the correct graph must show: - A gentle downward slope for AB (isothermal). - A vertical line for BC (isochoric). - A steeper downward slope for AC (adiabatic). After comparing the options provided in the figures, we find that **Graph B** correctly represents these characteristics. ### Final Answer The correct graph that represents the processes is **Graph B**. ---
Promotional Banner

Similar Questions

Explore conceptually related problems

Which of the following graphs correctly represents the variation of g on the - Earth?

The velocity -displacement graph of a particle is as shown in the figure. Which of the following graphs correctly represents the variation of acceleration with displacement?

Which of the following describes the given graph correctly ?

The given graph shows the variation of velocity with displacement. Which one of the graphs given below correctly represents the variation of acceleration with displacement ?

The given graph shows the variation of velocity with displacement. Which one of the graphs given below correctly represents the variation of acceleration with displacement ?

Which of the following graphs represents freundlich adsorption isotherm?

Which one of the following graphs represent a function? (FIGURE)

The curves A and B in the figure shown P-V graphs for an isothermal and an adiabatic process for an idea gas. The isothermal process is represented by the curve A.

The curves A and B in the figure shown P-V graphs for an isothermal and an adiabatic process for an idea gas. The isothermal process is represented by the curve A.

An ideal gas undergoes a cyclic process, in which one process is isochoric, one process is isothermal and one process is adiabatic. During the isothermal process, 40 J heat is released by the gas, and during the isochoric process, 80 J heat is absorbed by the gas. if work done by the gas during adiabatic process is W_(1) and during isothermal process is W_(2) then the magnitude of (W_(1))/(W_(2)) will be equal to: