A
B
C
D
Text Solution
Verified by Experts
The correct Answer is:


Similar Questions
Explore conceptually related problems
Recommended Questions
- A cyclic process ABCA shown in V-T diagram, is performed with a consta...
Text Solution
|
- A cyclic process ABCA shown in the V-T diagram is performed with a con...
Text Solution
|
- A Cycle process ABCA shown in V-T diagram Fig. is preformed with a con...
Text Solution
|
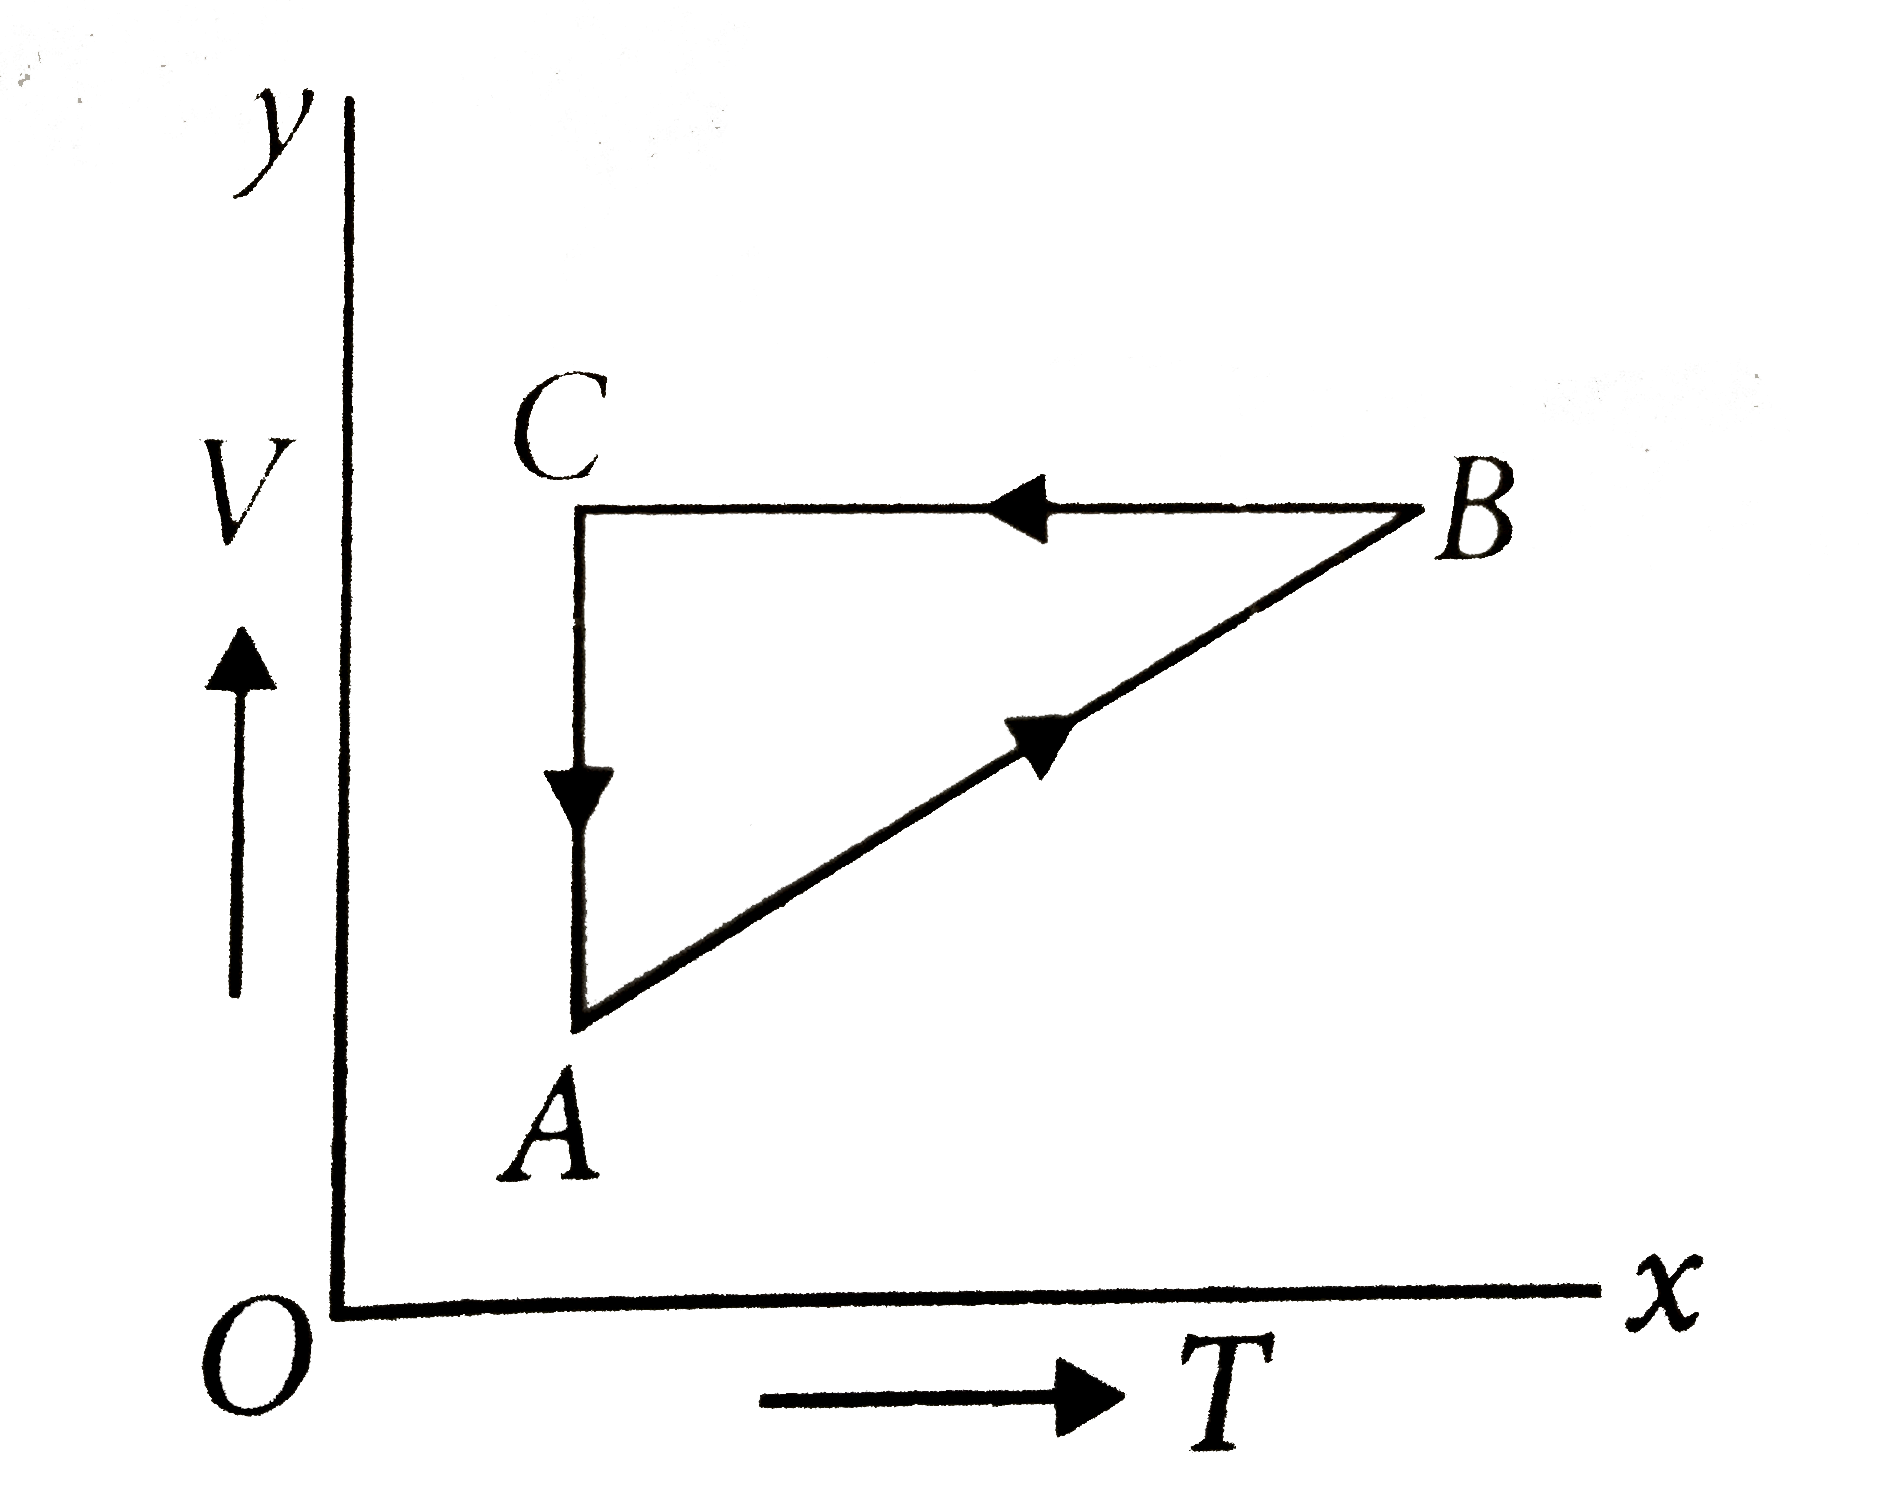
- A cyclic process ABCA is shown in the V-T diagram process on the P-V
Text Solution
|
- A cyclic process 1rarr2rarr3rarr1 shown in P-T diagram is performed wi...
Text Solution
|
- Two moles of an ideal monoatomic gas undergoes a cyclic process ABCA a...
Text Solution
|
- एक चक्रीय प्रक्रम ABCA चित्र में प्रदर्शित V-T आरेख के अुनसार नियत द्र...
Text Solution
|
- A cyclic process ABCA is shown in the V - T diagram . Process on the P...
Text Solution
|
- V - T आरेख में प्रदर्शित एक चक्रीय प्रक्रम ABCA , एक आदर्श गैस के नियत...
Text Solution
|