A
B
C
D
Text Solution
Verified by Experts
The correct Answer is:


Similar Questions
Explore conceptually related problems
Recommended Questions
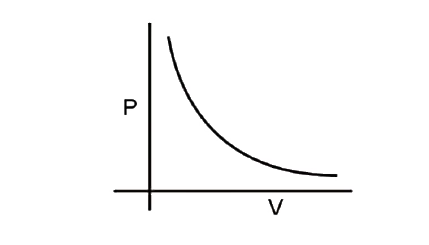
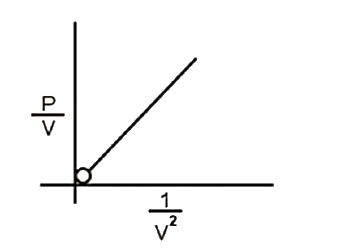
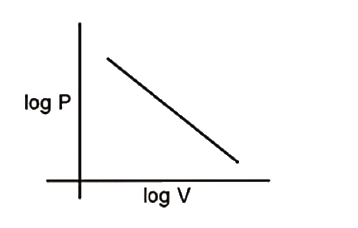
- Which of the following graph represents Boyle's law ?
Text Solution
|
- Which of the following curves does not represent Boyle's law?
Text Solution
|
- Which of the following graphs represents Boyle's law correctly? (i)
Text Solution
|
- Which of the following plots does not represent Boyle's law?
Text Solution
|
- Which of the following graph represents Boyle's law ?
Text Solution
|
- Which of the following curves represent(s) Boyle's law?
Text Solution
|
- Which of the following graph represent Boyle's law ?
Text Solution
|
- The graph representing Boyle's law is (are):
Text Solution
|
- Which of the following graphs represents the correct Boyle's law ?
Text Solution
|