A
B
C
D
Text Solution
Verified by Experts


Similar Questions
Explore conceptually related problems
Recommended Questions
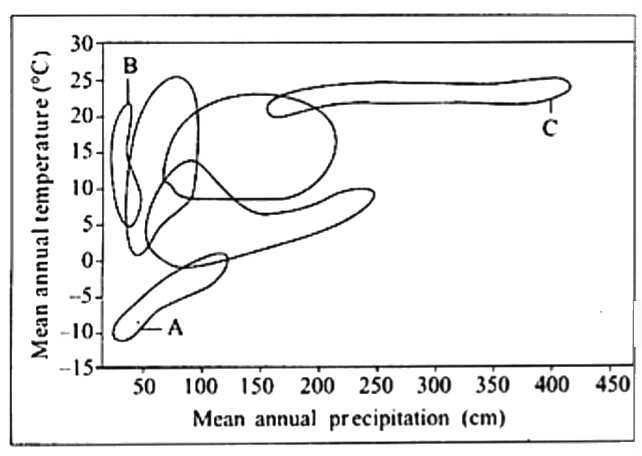
- The graph given below is showing biome distribution with respect to an...
Text Solution
|
- Biome distribution with respect to annual temperature and precipitatio...
Text Solution
|
- Which biome shows maximum range of annual precipitation and maximum ra...
Text Solution
|
- The graph given below is showing biome distribution with respect to an...
Text Solution
|
- The biome in which the mean annual temperature is approximately betwee...
Text Solution
|
- In the given diagram , Biome distribution is shown with respect to ann...
Text Solution
|
- Biome distribution with respect to annual temperature and precipitatio...
Text Solution
|
- (a) Explain how Mediterranean orchids achieve pollination. (b) Draw a ...
Text Solution
|
- Annual variation in duration and intensity of temperature for formatio...
Text Solution
|