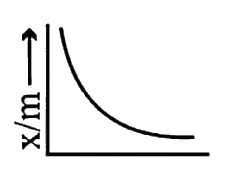
A
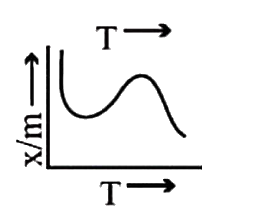
B
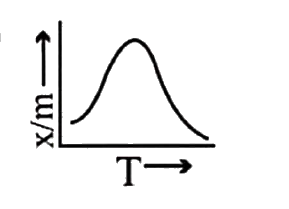
C
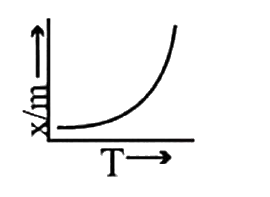
D
Text Solution
Verified by Experts
The correct Answer is:


Similar Questions
Explore conceptually related problems
Recommended Questions
- Which of the following graph represents the variation of amount of che...
Text Solution
|
- Which of the following graphs correctly represents the variation of be...
Text Solution
|
- At a constant pressure, of the following graphs that one which represe...
Text Solution
|
- Which of the following graphs correctly represents the variation of be...
Text Solution
|
- Which of following graphs correctly represent variation of alpha = (-(...
Text Solution
|
- Which plot is the adsorption isobar for chemisorption where x is...
Text Solution
|
- Which of the following graph represents the variation of amount of che...
Text Solution
|
- Which plot is the adsorption isobar for chemisorption where x is the a...
Text Solution
|
- If heat energy is given to an ideal gas at constant pressure, then sel...
Text Solution
|