A
B
C
D
Text Solution
Verified by Experts
The correct Answer is:


Similar Questions
Explore conceptually related problems
Recommended Questions
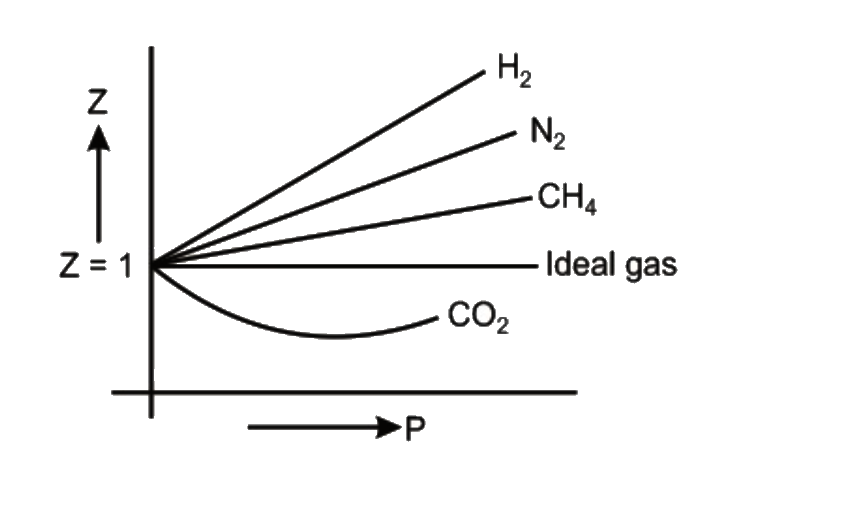
- Consider the graph between compressibility factor Z and pressure P, ...
Text Solution
|
- The ease of liquefaction of noble gases decreases in the order
Text Solution
|
- The ease of liquefaction of noble gases increases in the order
Text Solution
|
- The ease of liquefaction of noble gases increases in the order
Text Solution
|
- Consider the graph between compressibility factor Z and pressure P, Th...
Text Solution
|
- Compressibility factor (Z=(PV)/(nRT)) is plotted against pressure ...
Text Solution
|
- Compressibility factor (Z) is plotted against pressure at different te...
Text Solution
|
- दिया गया आलेख (graph), तीन वास्तविक गैसों A, B तथा C के लिए संपीड़यता ग...
Text Solution
|
- The ease of liquefaction of noble gases decreases in the order
Text Solution
|