A
B
C
D
Text Solution
Verified by Experts
The correct Answer is:


Similar Questions
Explore conceptually related problems
Recommended Questions
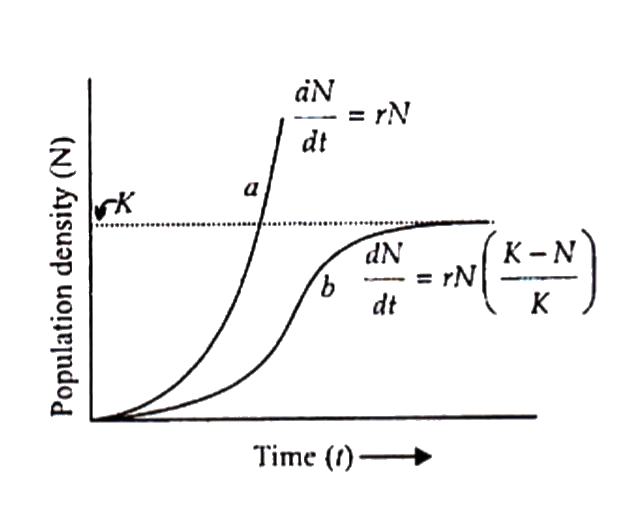
- The graph shows two types of the population growth curve, 'a' - Expone...
Text Solution
|
- Assertion: Logistic growth model is considered a more realistic as com...
Text Solution
|
- Which of the following is considered as more realistic growth model ?
Text Solution
|
- The graph shows two types of population growth curve A is exponential ...
Text Solution
|
- The graph shows two types of the population growth curve, 'a' - Expone...
Text Solution
|
- Population growth curve in most of organsims is Logistic/Exponential.
Text Solution
|
- What is "carrying capacity" of a species in a habitat? Why is logistic...
Text Solution
|
- Logistic growth model is more realistic than exponential growth model....
Text Solution
|
- The following graph shows two types of population growth curves: Name ...
Text Solution
|