A
B
C
D
Text Solution
Verified by Experts
The correct Answer is:


Similar Questions
Explore conceptually related problems
Recommended Questions
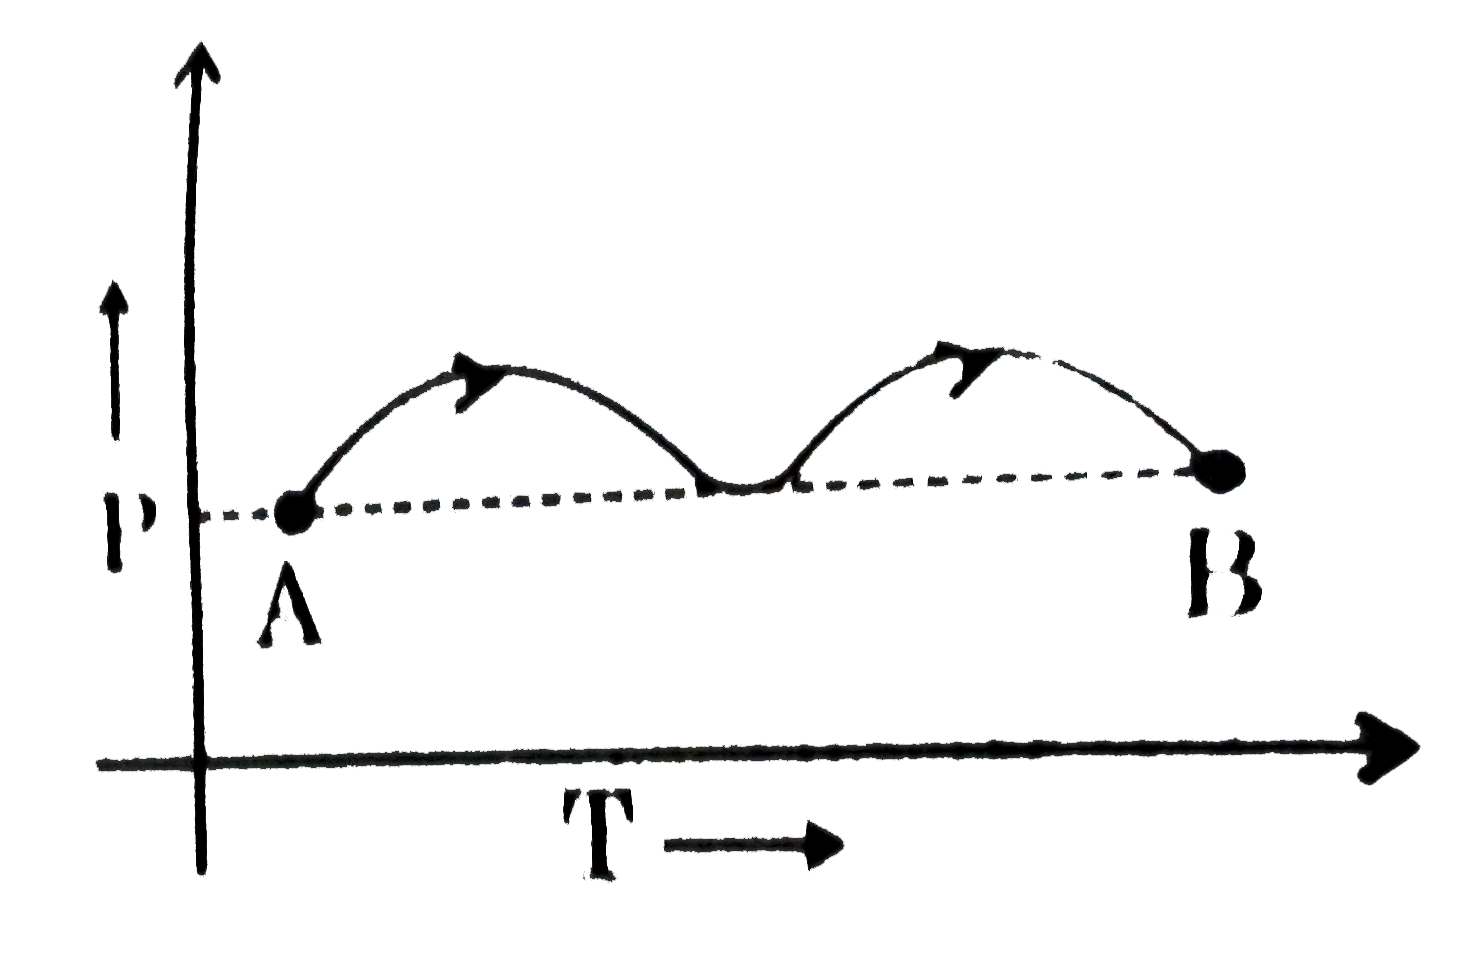
- The P-T graph, as given below, was observed for a process on an ideal ...
Text Solution
|
- Straight line on (p - T) graph for an ideal gas represents isochoric p...
Text Solution
|
- The P-T graph for the given mass of an ideal gas is shown in figure. T...
Text Solution
|
- An ideal gas undergoes a cyclic process A to B to C to D for which P –...
Text Solution
|
- The graph given below shows the P-V plot for a process on an ideal gas...
Text Solution
|
- The P-T graph, as given below, was observed for a process on an ideal ...
Text Solution
|
- The P-T graph, as given below, was observed for a process on an ideal ...
Text Solution
|
- For the given P-V graph for an ideal gas, chose the correct V-T graph....
Text Solution
|
- Straight line on (p - T) graph for an ideal gas represents isochoric p...
Text Solution
|