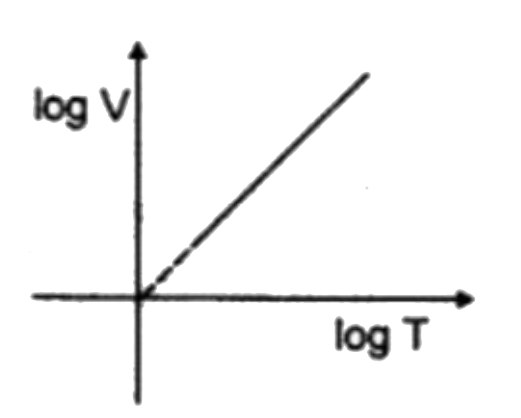
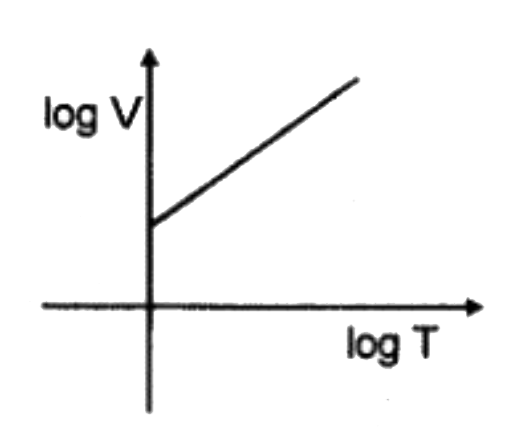
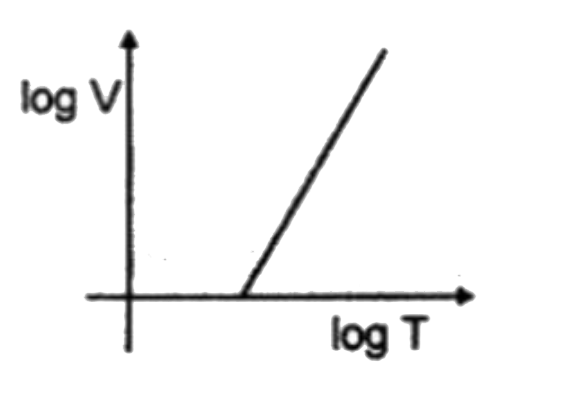
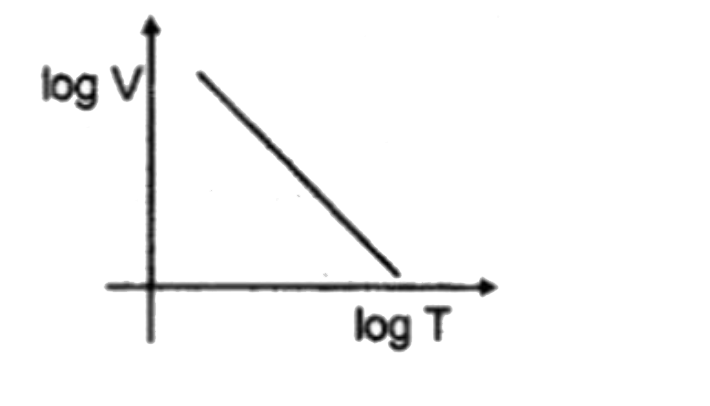
Home
Class 12
CHEMISTRY
Which of the following sketches is an is...

Which of the following sketches is an isobars (Given : `(nR)/(P) gt 1` )

A

B

C

D

Text Solution

AI Generated Solution

The correct Answer is:
To solve the question regarding which of the provided sketches represents isobars, given the condition \( \frac{nR}{P} > 1 \), we can follow these steps: ### Step 1: Understand the Ideal Gas Law The ideal gas law is given by the equation: \[ PV = nRT \] From this, we can express the volume \( V \) in terms of pressure \( P \) and temperature \( T \): \[ V = \frac{nRT}{P} \] ### Step 2: Analyze the Given Condition We are given the condition: \[ \frac{nR}{P} > 1 \] This implies: \[ V > T \] This means that for the isobars we are looking for, the volume must be greater than the temperature. ### Step 3: Rewrite the Condition in Logarithmic Form To find the appropriate graph, we can express the condition in logarithmic terms: \[ \log V > \log T \] This means we need to find a graph where the logarithm of volume is greater than the logarithm of temperature. ### Step 4: Evaluate Each Graph We have four graphs to evaluate: 1. **Graph 1**: \( V = T \) (This means \( \log V = \log T \)) - This does not satisfy our condition since \( \log V \) is not greater than \( \log T \). 2. **Graph 2**: \( V > T \) (This means \( \log V > \log T \)) - This satisfies our condition, making this a valid representation of isobars. 3. **Graph 3**: \( T > V \) (This means \( \log T > \log V \)) - This does not satisfy our condition since \( \log T \) is not greater than \( \log V \). 4. **Graph 4**: Mixed conditions where \( V > T \) at one point and \( T > V \) at another. - This does not consistently satisfy our condition. ### Conclusion Based on the evaluation of the graphs, the correct answer is **Graph 2**, where \( \log V > \log T \).
Promotional Banner

Similar Questions

Explore conceptually related problems

Which of the following pairs represents isobars?

Which of the following process lead to formation of isobars ?

Which of the following is a V-T curve for isobaric process?

Which of the following process not lead to formation of isobars?

In which of the following reaction K_(p) gt K_(c)

In which of the following reaction K_(p) gt K_(c)

In which of the following reaction K_(p) gt K_(c)

Which of the following when mixed, will given a solution with pH gt 7 .

Which of the following could be the sketch graph of y = (d(xlnx))/dx

Which of these are a pair of Isotones and Isobars?