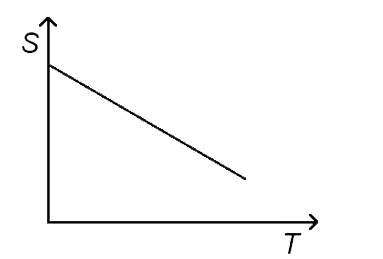
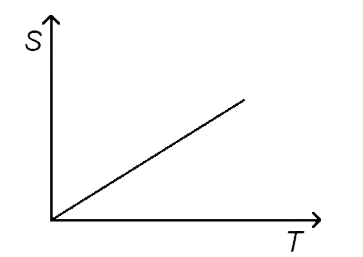
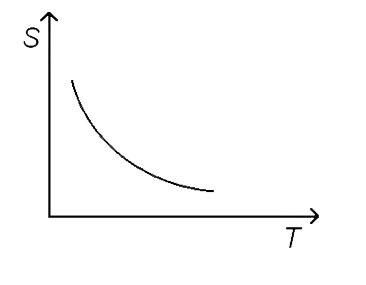
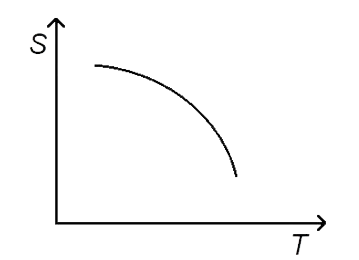
Home
Class 12
PHYSICS
The correct graph which shows the variat...

The correct graph which shows the variation of paramagnetic susceptibility S with temperature T is

A

B

C

D

Text Solution

AI Generated Solution

The correct Answer is:
To solve the problem of determining the correct graph that shows the variation of paramagnetic susceptibility (S) with temperature (T), we can follow these steps: ### Step 1: Understand the relationship between susceptibility and temperature Paramagnetic susceptibility (S) is known to be inversely proportional to the absolute temperature (T). This means that as the temperature increases, the susceptibility decreases. ### Step 2: Write the mathematical expression From the relationship, we can express this as: \[ S \propto \frac{1}{T} \] This can also be written as: \[ S = \frac{k}{T} \] where \( k \) is a constant. ### Step 3: Analyze the graph of the relationship The equation \( S = \frac{k}{T} \) indicates that the graph of S versus T will be a hyperbola. Specifically, it will be a rectangular hyperbola that approaches the axes but never touches them. ### Step 4: Identify the characteristics of the graph In a graph of S versus T: - As T increases, S decreases. - The graph will not intersect the axes, indicating that S approaches zero as T approaches infinity. ### Step 5: Select the correct graph Given the options available, we need to identify which graph represents a rectangular hyperbola. The correct graph will show a curve that decreases as T increases, demonstrating the inverse relationship. ### Conclusion After analyzing the options, we find that the third option represents the correct graph, which is a rectangular hyperbola showing the variation of paramagnetic susceptibility (S) with temperature (T). ### Final Answer The correct option is **C**. ---
Promotional Banner

Similar Questions

Explore conceptually related problems

Choose the correct graph of variation of magnetic susceptibility X_m of paramagnetic substance versus absolute temperature T.

The graph which represents the variation of mean kinetic energy of moleules with temperature ""^(@)C is ?

The variation of magnetic susceptibility (chi) with absolute temperature T for a ferromagnetic material is

The variation of magnetic susceptibility (chi) with temperature for a diamagnetic substance is best represented by

The variation of magnetic susceptibility (chi) with temperature for dimagnetic substance is represented by

Which of the following graph represents the variation of resistivity ( rho ) with temperature (T) for copper?

Point out the best representation of relation between magnetic susceptibility (Chi) and temperature (T) for a paramagnetic material

Figure (a) and figure (b) both are showing the variation of resistivity (p) with temperature (T) for some materials. Identify the types of these materials.

Which of the following show paramagnetism ? .

Show on a graph, the variation of resistivity with temperature for a typical semiconductor.