A
B
C
D
Text Solution
Verified by Experts
The correct Answer is:


Similar Questions
Explore conceptually related problems
Recommended Questions
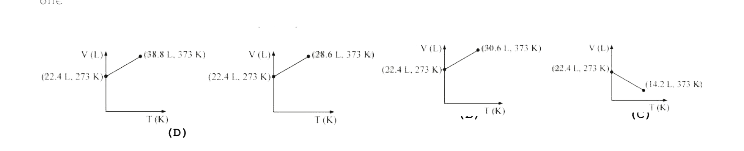
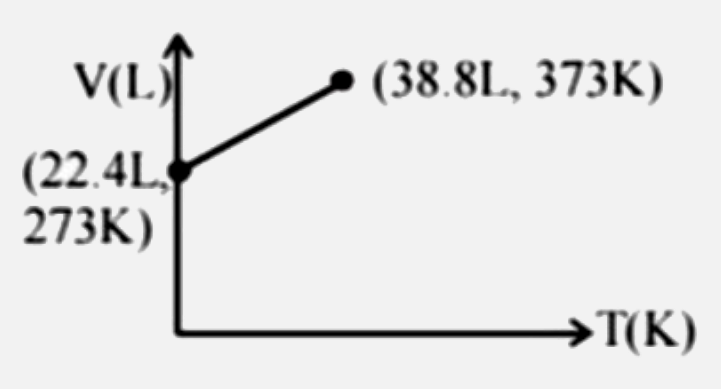
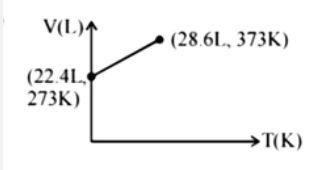
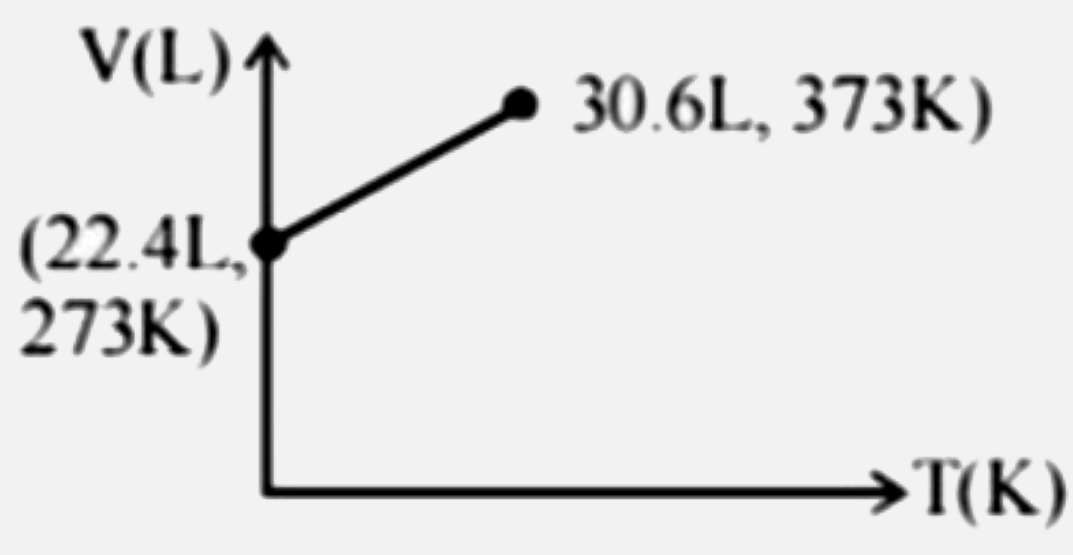
- Which of the following volume (V) –temperature (T) plots represents th...
Text Solution
|
- Which of the following volume-temperature (V-I) plots represents the b...
Text Solution
|
- Which of the following volume (V)-temperature (T) plots represents the...
Text Solution
|
- Which of the following volume (V) - temperature (T) plots represents t...
Text Solution
|
- Which of the following volume-temperature (V-I) plots represents the b...
Text Solution
|
- Which of the following volume (V)-temperature (T) plots represents the...
Text Solution
|
- निम्न में से कौन - सा आयतन (V), ताप (T) ग्राफ ( आलेख ) , एक वायुमंडल...
Text Solution
|
- Which one of the following volume (V)- temperature (T) plots represent...
Text Solution
|
- Which of the following volume (V) temperature (T) plots represents the...
Text Solution
|