A
B
C
D
Text Solution
Verified by Experts
The correct Answer is:


Similar Questions
Explore conceptually related problems
Recommended Questions
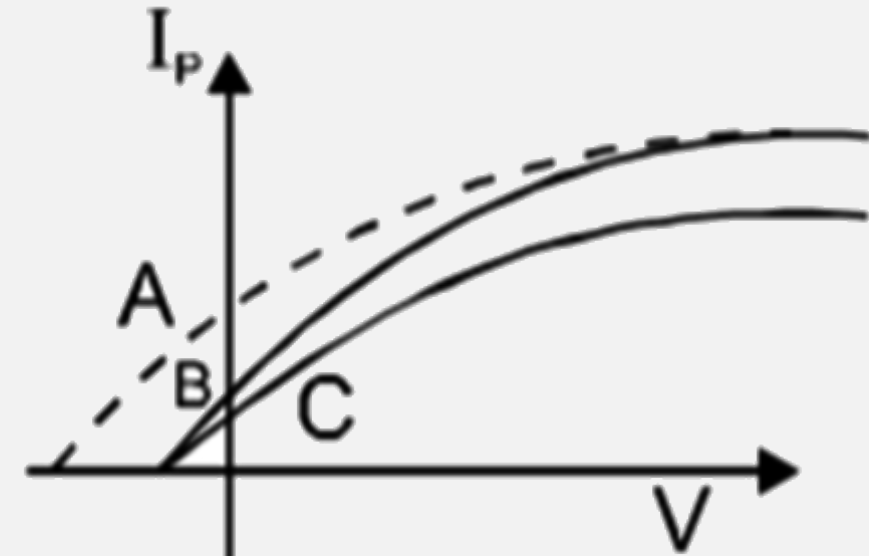
- The graph shows the variation of photocurrent with the applied voltage...
Text Solution
|
- Plot a graph showing the variation of photoelectric current with anode...
Text Solution
|
- The photocurrent in an experiment on photoelectric effect increases if
Text Solution
|
- The graph is showing the photocurrent with the applied voltage of a ph...
Text Solution
|
- Thefigure shows the results of an experiment involving photoelectric e...
Text Solution
|
- Draw graphs showing variation of photoelectric current with applied vo...
Text Solution
|
- Figure shows the results of an experiment involving photoelectric effe...
Text Solution
|
- Figure shows a results of an experiment inolving photoelectric effect....
Text Solution
|
- When stopping potential is applied in an experiment on photoelectric e...
Text Solution
|