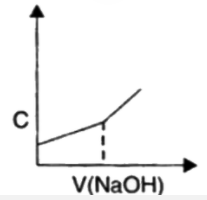
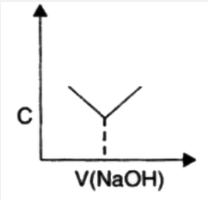
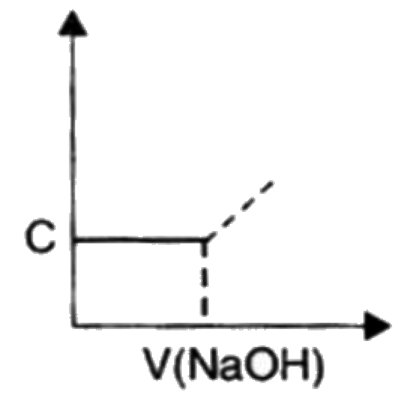
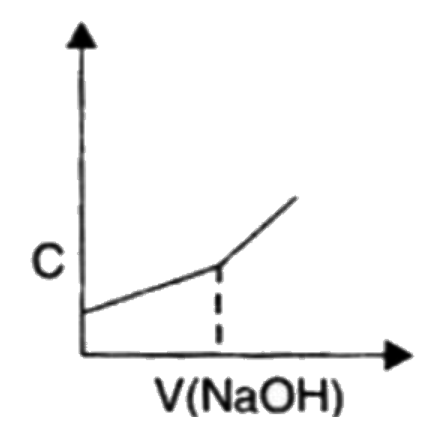
Home
Class 12
CHEMISTRY
Which of the following curve will repres...

Which of the following curve will represent the variation of conductance C during titration of `CH_(3)COOH` by gradual addition of NaOH solution (V)

A

B

C

D

Text Solution

AI Generated Solution

The correct Answer is:
To determine the variation of conductance (C) during the titration of acetic acid (CH₃COOH) with sodium hydroxide (NaOH), we can analyze the process step by step. ### Step-by-Step Solution: 1. **Understanding the Reaction**: - When acetic acid (a weak acid) reacts with sodium hydroxide (a strong base), they undergo a neutralization reaction to form sodium acetate (a salt) and water. - The reaction can be represented as: \[ \text{CH}_3\text{COOH} + \text{NaOH} \rightarrow \text{CH}_3\text{COONa} + \text{H}_2\text{O} \] 2. **Initial Conductance**: - Initially, the solution contains only acetic acid, which partially ionizes to produce H⁺ and CH₃COO⁻ ions. The conductance at this stage is relatively low because acetic acid is a weak acid and does not produce a high concentration of ions. 3. **Adding NaOH**: - As NaOH is gradually added, it reacts with the acetic acid, leading to the formation of sodium acetate. The concentration of ions in the solution increases, which leads to an increase in conductance. - However, this increase is gradual because the mobility of the ions formed from the weak acid is lower compared to the ions from the strong base. 4. **At the Equivalence Point**: - At the equivalence point, all the acetic acid has reacted with NaOH, and the solution contains only sodium acetate and water. - The conductance will reach a certain level at this point due to the presence of the salt. 5. **Post-Equivalence Point**: - After the equivalence point, if more NaOH is added, the concentration of OH⁻ ions increases significantly. Since OH⁻ ions have high mobility, the conductance increases rapidly. - This rapid increase in conductance is due to the presence of excess OH⁻ ions in the solution. 6. **Graph Representation**: - The graph representing the conductance (C) against the volume of NaOH (V) will show a gradual increase in conductance before the equivalence point, followed by a steep increase after the equivalence point. ### Conclusion: The correct representation of the variation of conductance during the titration of acetic acid with sodium hydroxide will show a gradual increase up to the equivalence point, followed by a sharp increase after the equivalence point. Therefore, the correct option is **option D**.
Promotional Banner

Similar Questions

Explore conceptually related problems

Which of the following curve represents the variation of lambda_(M) with sqrt(C) for AgNO_(3) ?

Which of the following curve represent variation of density of water with temperature best-

Which of the following curve gives the variation of Lambda_(m) "with" sqrtC " for " CH_(3)COOH ?

Which of the following curves correctly represent the variation of capacitve reactance ( underset(C )(X) ) with frequency (f) ?

Which of the following is not the isomer of CH_(3)COOH ?

Which of the following compound will given yellow precipitate on shaking with aqueous solution of NaOH followed by the addition of AgNO_(3) solution ?

Which of the following pH curve represent the titration of weak acid and strong base (dotted line show equivalence point)?

Which of the following combinations of solute would result in the formation of a buffer solution. a. CH_(3)COOH +NaOH in i. 1:1 mol ratio ii. 2:1 mol ratio iii. 1:2 mol ratio b. NH_(4)CI=NH_(3) in i. 1:1 mol ratio ii. 2:1 mol ratio iii. 1:2 mol ratio c. HCI +NaCI d. HCI +CH_(3)COOH e. NaH +HCI

The given curve represents the variation of temperatue as a function of volume for one mole of an ideal gas. Which of the following curves best represents the variation of pressure as a function of volume ? .

The given curve represents the variation of temperatue as a function of volume for one mole of an ideal gas. Which of the following curves best represents the variation of pressure as a function of volume ? .