A
B
C
D
Text Solution
Verified by Experts
The correct Answer is:


Similar Questions
Explore conceptually related problems
Recommended Questions
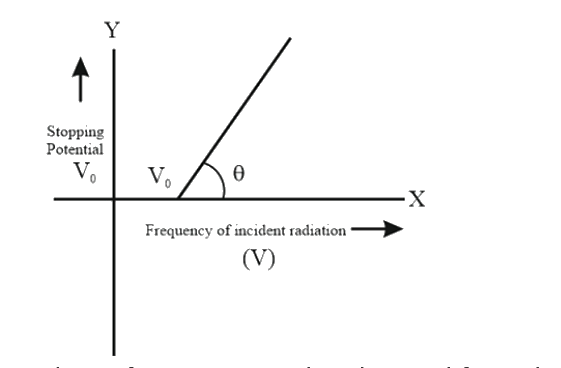
- The graph between frequency of incident radiations and stopping potent...
Text Solution
|
- Draw a graph showing the variation of stopping potential with frequenc...
Text Solution
|
- Sketch a graph between frequency of incident radiations and stopping p...
Text Solution
|
- Sketch the graphs, showing the variation of stopping potential Vs with...
Text Solution
|
- The stopping potential for acertain photosensitive metal is Vq when th...
Text Solution
|
- Which of the following is the graph between the frequency (v) of the i...
Text Solution
|
- दी गई प्रकाश संवेदी सतह के लिए निरोधी विभव आपतित विकिरण की आवृत्ति के ...
Text Solution
|
- The graph between frequency of incident radiations and stopping potent...
Text Solution
|
- A graph of stopping potential of a photo sensitive metal with the freq...
Text Solution
|