A
B
C
D
Text Solution
Verified by Experts
The correct Answer is:


Similar Questions
Explore conceptually related problems
Recommended Questions
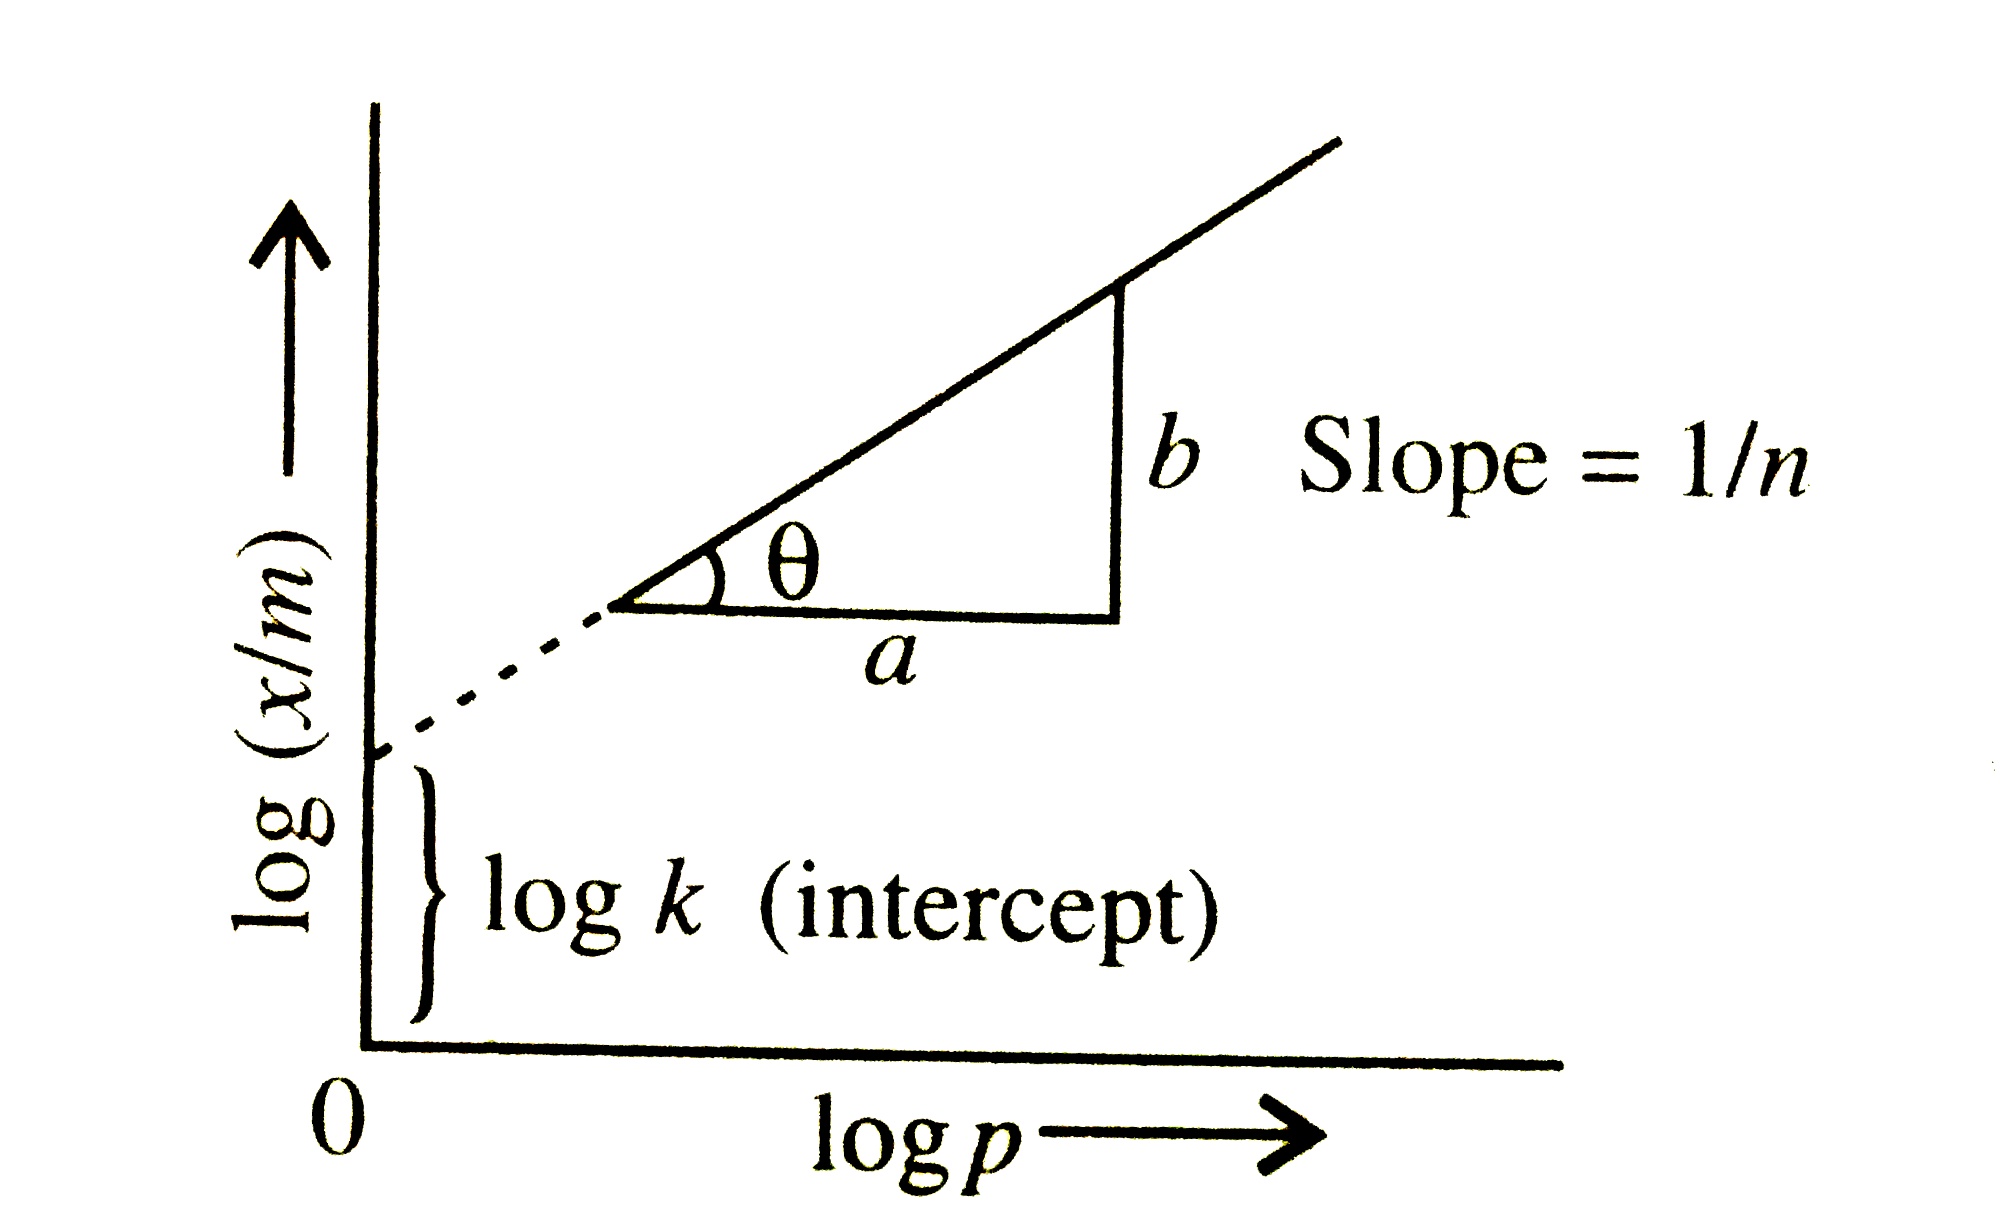
- A graph is plotted between log (x/m) and log p according to the equati...
Text Solution
|
- For a linear plot of log (x/m) versus log p in a Freundlich adsorption...
Text Solution
|
- For a linear plot of log(x/m) versus log p in a Freundlich adsorption ...
Text Solution
|
- फ़्रॉयंडलीक अधिशोषण में log(x//m) तथा log p के मध्य खींचे गये ग्राफ में...
Text Solution
|
- A graph is plotted between log(x//m) and log P according to the equati...
Text Solution
|
- फ्रॉयंडलिक अधिशोषण समतापी वक्र में log (x//m) तथा log P के बीच खींचे ग...
Text Solution
|
- Graph between log((x)/(m)) and log P is straight line at angle of 45^(...
Text Solution
|
- Adsorption of a gas follows Freundlich adsorption isotherm. x is the m...
Text Solution
|
- For a linear plot of log (x/m) versus log p in a Freundlich adsorption...
Text Solution
|