A
B
C
D
Text Solution
Verified by Experts
The correct Answer is:


Similar Questions
Explore conceptually related problems
Recommended Questions
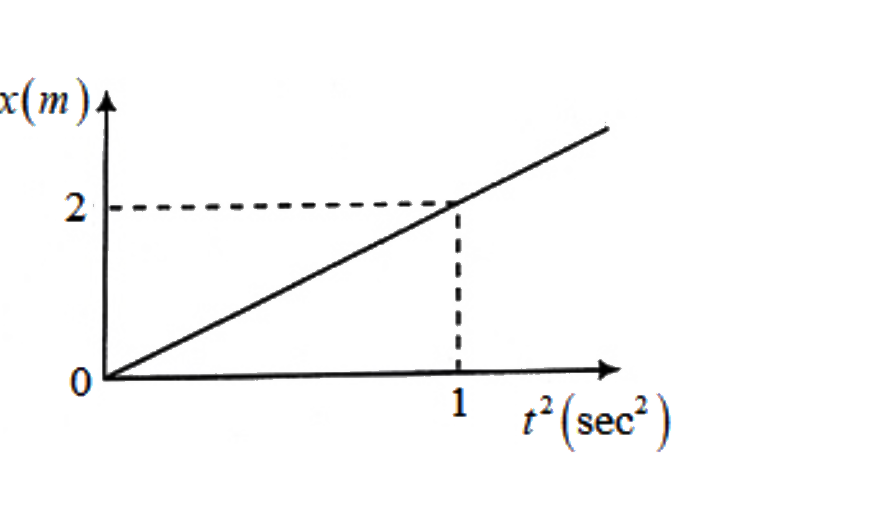
- Displacement x versus t^(2) graph is shown for a particle. The acceler...
Text Solution
|
- The acceleration versus time graph of a particle is shown in the figur...
Text Solution
|
- Velocity versus displacement graph of a particle moving in a straight ...
Text Solution
|
- Velocity versus displacement graph of a particle moving in a straight ...
Text Solution
|
- Graph of velocity versus displacement of a particle moving in a straig...
Text Solution
|
- Velocity versus displacement graph of a particle moving in a straight ...
Text Solution
|
- The acceleration versus displacement graph of a particle performing SH...
Text Solution
|
- A graph of acceleration versus time of a particle starting from rest a...
Text Solution
|
- Displacement x versus t^(2) graph is shown for a particle. The acceler...
Text Solution
|