A
B
C
D
Text Solution
Verified by Experts
The correct Answer is:


Similar Questions
Explore conceptually related problems
Recommended Questions
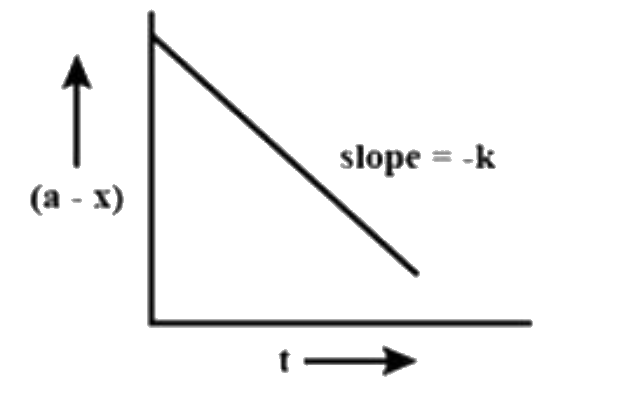
- Two plots are shown below between concentration and time t. Which of t...
Text Solution
|
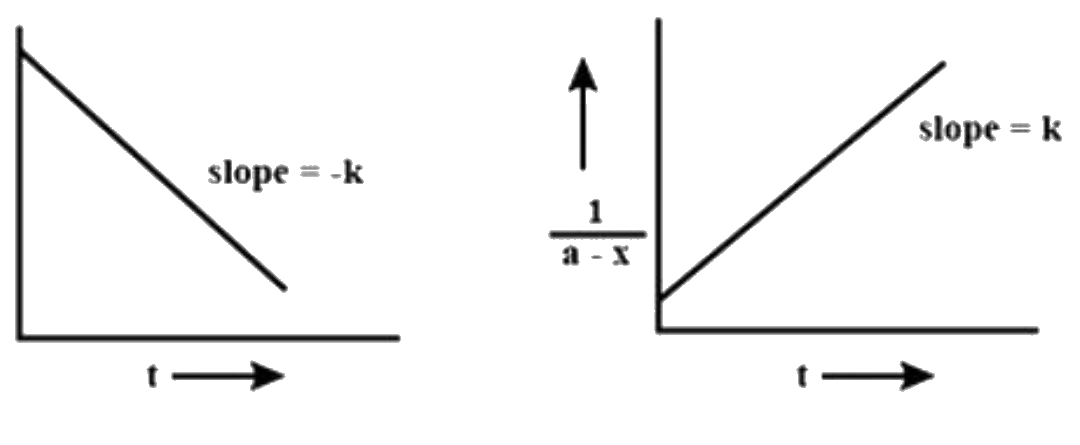
- In the decompoistion of N(2)O(5), the plot between the reciprocal of c...
Text Solution
|
- For a reaction , a graph was plotted between reactant concentration c ...
Text Solution
|
- Acceleration A and time period T of a body in S.H.M. is given by a cur...
Text Solution
|
- Observe the given graphs carefully. Which of the given orders are show...
Text Solution
|
- When a plot between logk and 1/T is plotted we get the graph as shown....
Text Solution
|
- Two plots are shown below between concentration and time t. Which of t...
Text Solution
|
- The graph plotted between concentration versus time
Text Solution
|
- The vapour pressure of a solution (b) as a function of temperature (a)...
Text Solution
|