Text Solution
Verified by Experts
The correct Answer is:


Similar Questions
Explore conceptually related problems
Recommended Questions
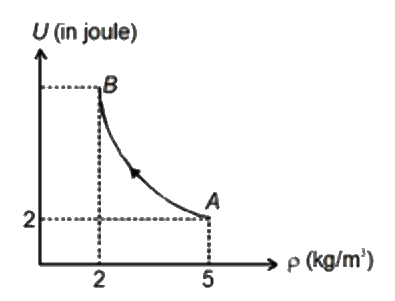
- Figure shows the variation of the internal energy U with the density r...
Text Solution
|
- Find work done by the gas in the process AB shown in the following fig...
Text Solution
|
- An ideal monoatomic gas undergoes a process in which its internal ener...
Text Solution
|
- An ideal monoatomic gas undergoes the process AB as shown in the figur...
Text Solution
|
- Two moles of a monoatomic ideal gas undergoes a process AB as shown in...
Text Solution
|
- Figure demonstrates a polytropic process (i.e.PV^(n) = constant ) for ...
Text Solution
|
- Figure shows the variations of the internal energy U With density rho ...
Text Solution
|
- Figure shows the variation of the internal energy U with the density r...
Text Solution
|
- Find work done by the gas in the process AB shown in the following fig...
Text Solution
|