A
B
C
D
Text Solution
Verified by Experts
The correct Answer is:


Similar Questions
Explore conceptually related problems
Recommended Questions
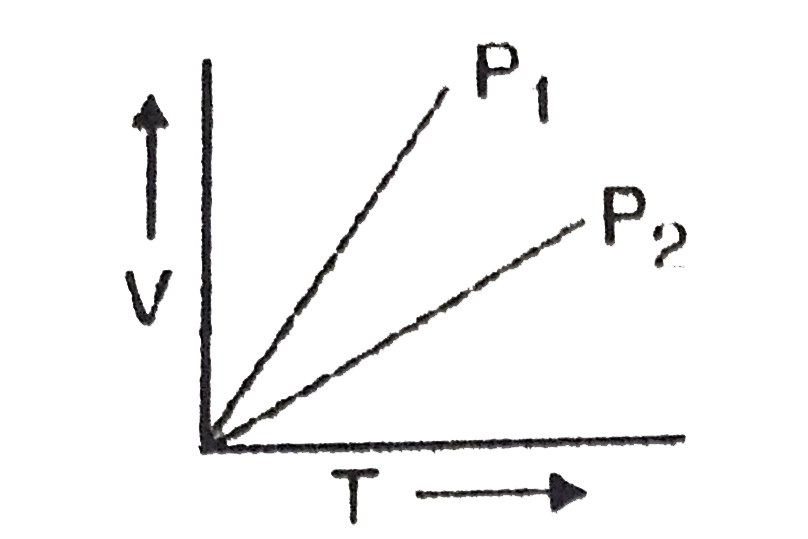
- V vs T curves at constant pressure P(1) and P(2) for an ideal gas are ...
Text Solution
|
- V vs T curves at different pressures P(1) and P(2) for an ideal gas ar...
Text Solution
|
- For an ideal gas V - T curves at constant pressure P(1) & P(2) are sho...
Text Solution
|
- V vs T curves at constant pressure P(1) and P(2) for an ideal gas are ...
Text Solution
|
- A plot of P vs T for a given mass of gas at constant volume is a strai...
Text Solution
|
- For one mole of an ideal gas the slope of V vs. T curve at constant pr...
Text Solution
|
- For one mole of an ideal gas the slope of V vs. T curve at constant pr...
Text Solution
|
- When an ideal gas at a pressure P, temperature T and volume V is isoth...
Text Solution
|
- When a ideal gas with pressure P and volume V is compressed isothermal...
Text Solution
|