A
B
C
D
Text Solution
Verified by Experts
The correct Answer is:


Similar Questions
Explore conceptually related problems
Recommended Questions
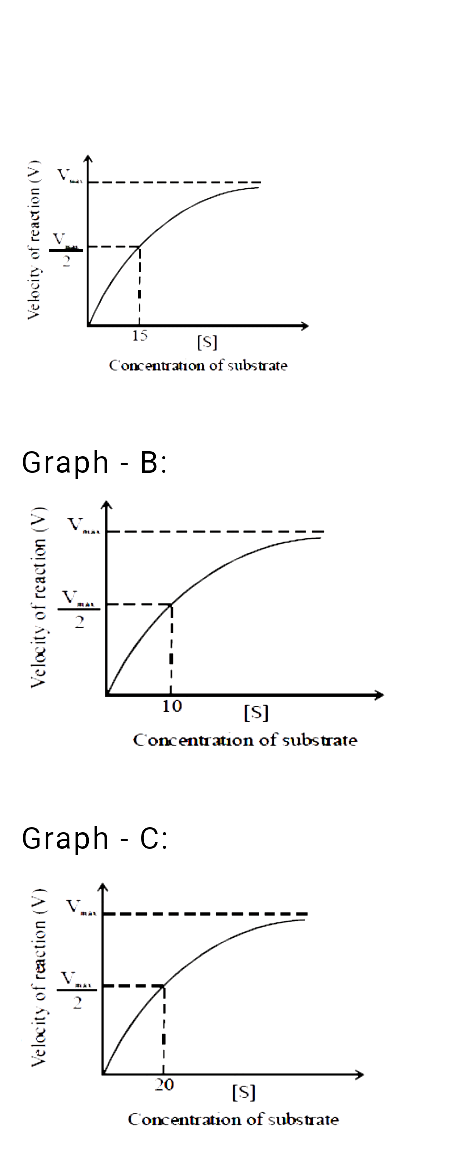
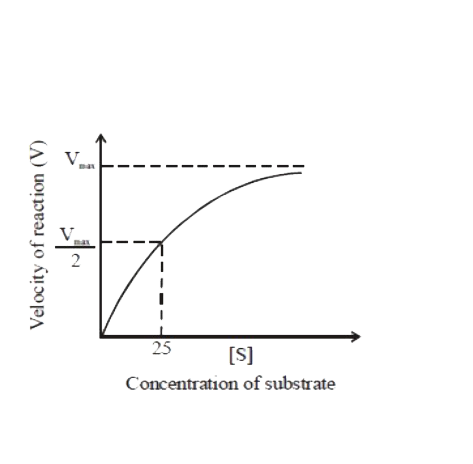
- Following graphs show the effect of change in concentration of substra...
Text Solution
|
- Which enzyme shows greatest substrate specificity
Text Solution
|
- Assertion : Enzyme substrate complex remains throughout the reaction. ...
Text Solution
|
- The given graph shows the effect of substrate concentration on the rat...
Text Solution
|
- The given graph shows the effect of substrate concentration on the ra...
Text Solution
|
- The given graph shows the effect of substrate concentration on the rat...
Text Solution
|
- Following graphs show the effect of change in concentration of substra...
Text Solution
|
- Explain the effect of substrate concentration on enzyme activity
Text Solution
|
- Describe the effect of substrate concerntration on enzyme activity.
Text Solution
|