A
B
C
D
Text Solution
Verified by Experts
The correct Answer is:


Similar Questions
Explore conceptually related problems
Recommended Questions
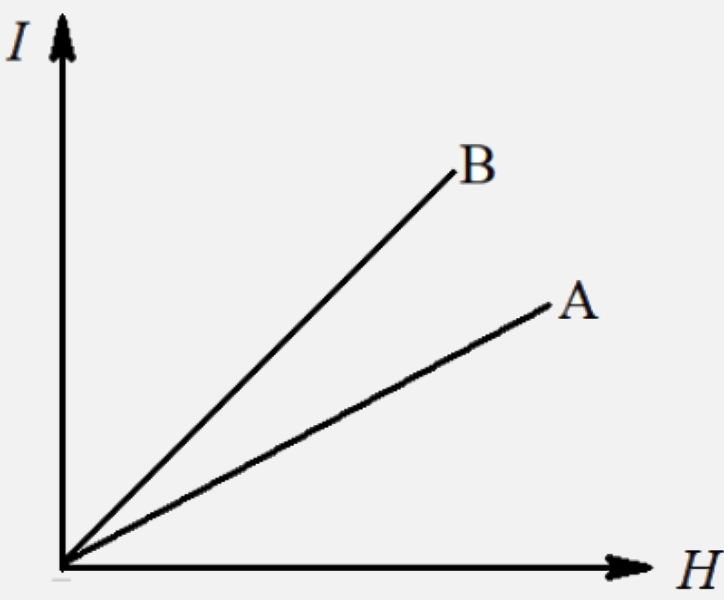
- The following figure shows the variation of intensity of magnetisation...
Text Solution
|
- When a small magnetising field H is applied to a magnetic material, th...
Text Solution
|
- When a small magnetising field H is applied to a magnetic material the...
Text Solution
|
- The following figure shows the variation of intensity of magnetisation...
Text Solution
|
- A material for which magnetic susceptibility is independent of tempera...
Text Solution
|
- The following figure shows the variation of intensity of magnetisation...
Text Solution
|
- The magnetic induction and magnetising field intensity in a sample of ...
Text Solution
|
- The following figure shows the variation of intensity of magnetisation...
Text Solution
|
- चित्र 8.33 में दो पदार्थों A और B के लिए लगाई गई चुम्बकीय क्षेत्र तीव्...
Text Solution
|