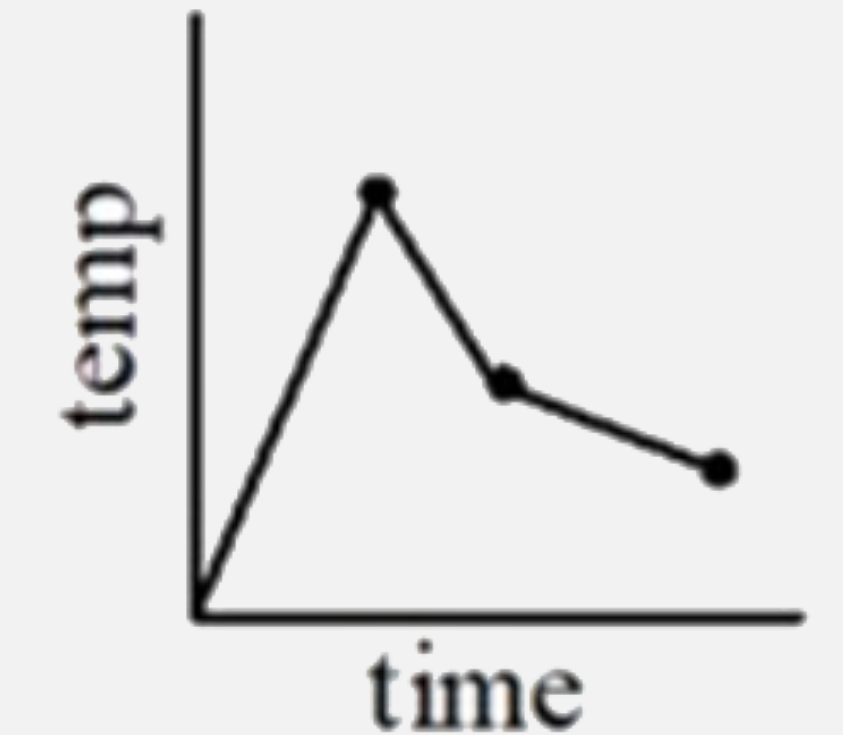
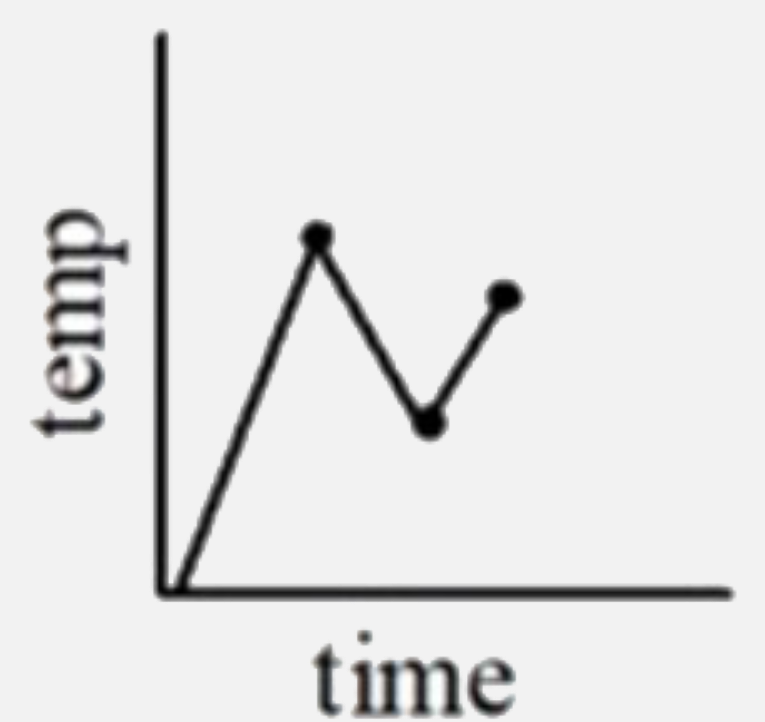
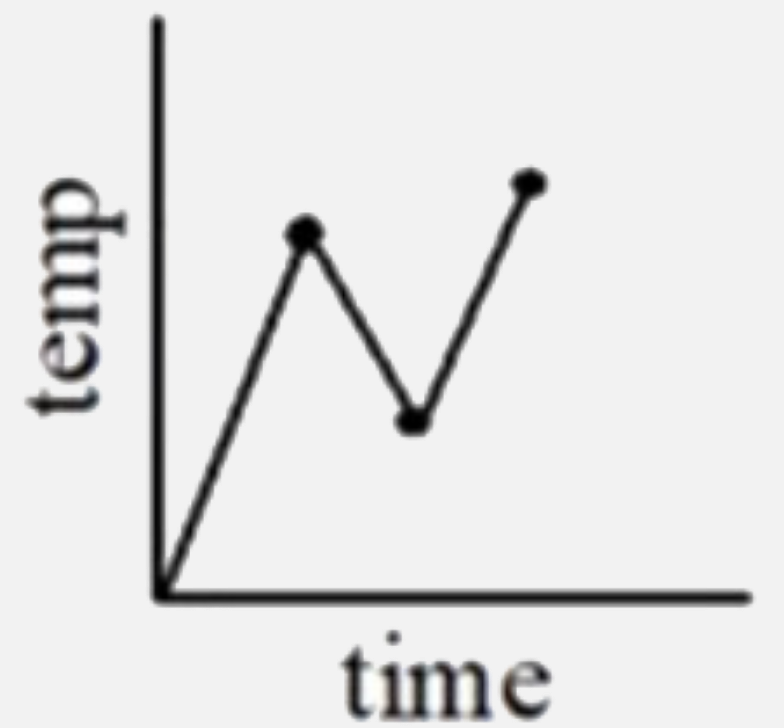
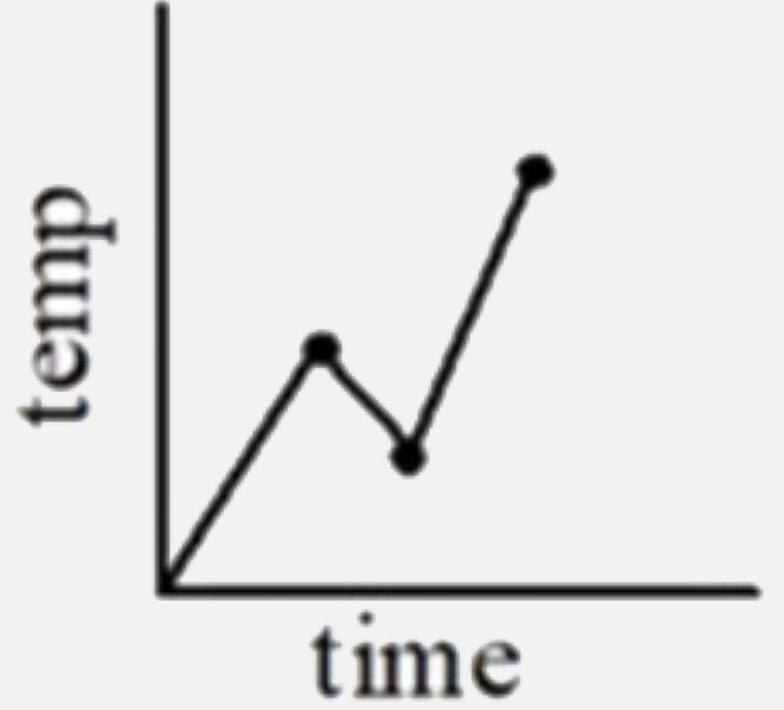
Home
Class 12
BIOLOGY
Which of the following graphs best depic...

Which of the following graphs best depicts the changes in one cycle of PCR ?

A

B

C

D

Text Solution

AI Generated Solution

The correct Answer is:
To determine which graph best depicts the changes in one cycle of PCR (Polymerase Chain Reaction), we need to understand the three main steps involved in PCR and how they relate to temperature changes over time. ### Step-by-Step Solution: 1. **Understanding PCR Steps**: - **Denaturation**: The first step involves heating the DNA to around 94-95°C, which causes the double-stranded DNA to separate into single strands. - **Annealing**: The temperature is then lowered to approximately 50-56°C to allow primers to bind to the single-stranded DNA. - **Extension**: The temperature is raised to about 72°C, where the DNA polymerase extends the primers to synthesize new strands of DNA. 2. **Analyzing Temperature Changes**: - During the **denaturation** phase, the temperature sharply increases. - In the **annealing** phase, the temperature decreases. - In the **extension** phase, the temperature increases again, but not as sharply as during denaturation. 3. **Graph Interpretation**: - The graph should show a sharp increase in temperature (denaturation), followed by a decrease (annealing), and then a moderate increase (extension). - The correct graph will reflect these temperature changes accurately over the time taken for one cycle of PCR. 4. **Choosing the Correct Option**: - Based on the description of the temperature changes, the correct graph will show: - A steep rise (denaturation) - A drop (annealing) - A slight rise (extension) - Any graph that does not follow this pattern will be incorrect. 5. **Final Answer**: - After analyzing the options, the graph that correctly represents these changes is the one that shows a sharp increase, followed by a decrease, and then a slight increase.
Promotional Banner

Similar Questions

Explore conceptually related problems

Which one of the following is best lewis base ?

Which of the following graphs best represents the variation of acceleration 'a' with displacement x?

100 mL of 0.1 HCl is taken in a beaker and to it 100 mL of 0.1 M NaOH is added in steps of 2ml and the pH is continuously measured . Which of the following graphs correctly depicts the change in pH

The graph shown the variation with times t of the velocity v of an object . Which one of the following graphs best represents the variation of acceleration a of the object with time t ?

Which of the following graphs correctly depicts the rate of photosynthesis of sun plant (P) and shade plant (Q)?

A constant voltage at different frequencies is applied across a capacitance. C as shown in the figure. Which of the following graphs correctly depicts the varitaion of current with frequency?

Which of the following depict the same ?

In which of the following graphs, the total change in momentum is zero ?

Which one of the following shows the last diploid stage in the life cycle of angiosperms ?