A
B
C
D
Text Solution
Verified by Experts
The correct Answer is:


Similar Questions
Explore conceptually related problems
Recommended Questions
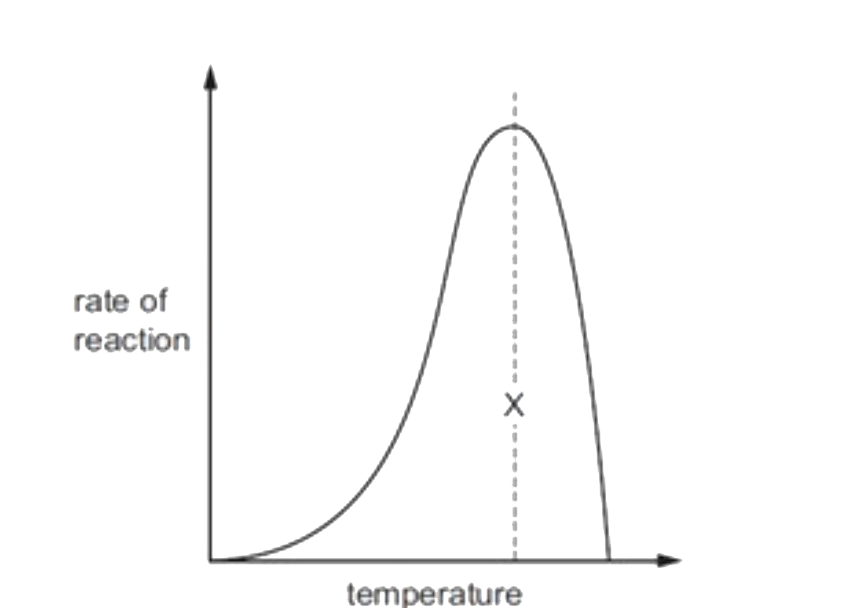
- The graph shows the effect of temperature on the rate at which the enz...
Text Solution
|
- Refer to the given graph showing relationship between temperature and ...
Text Solution
|
- Which enzyme helps in removing oil stains from clothes Or Which en...
Text Solution
|
- From the following, the statement /s that will help to determine the s...
Text Solution
|
- The graph shows the effect of temperature on the rate at which the enz...
Text Solution
|
- The diagram shows the effect of an enzyme working in the human digest...
Text Solution
|
- From the following, the statement /s that will help to determine the s...
Text Solution
|
- Which is the digestive juice without enzymes?
Text Solution
|
- Refer to the given graph showing relationship between temperature and ...
Text Solution
|