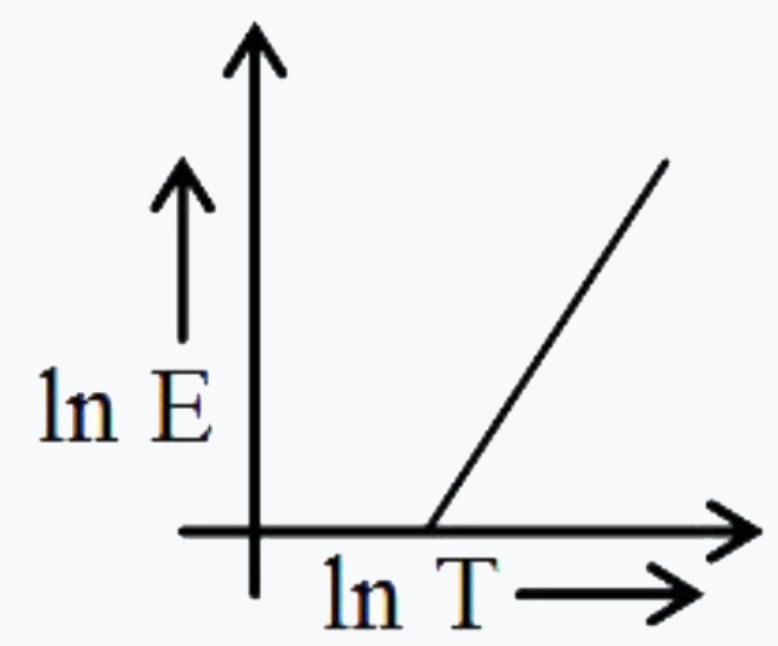
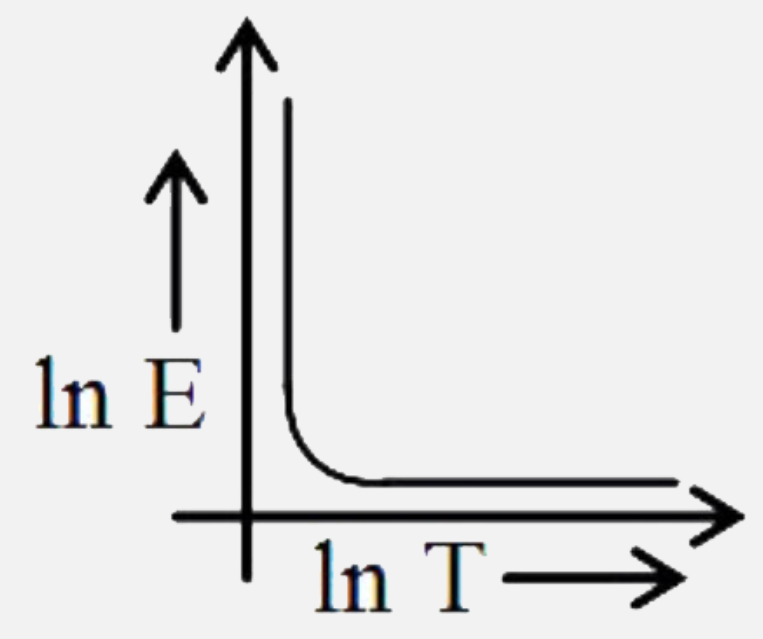
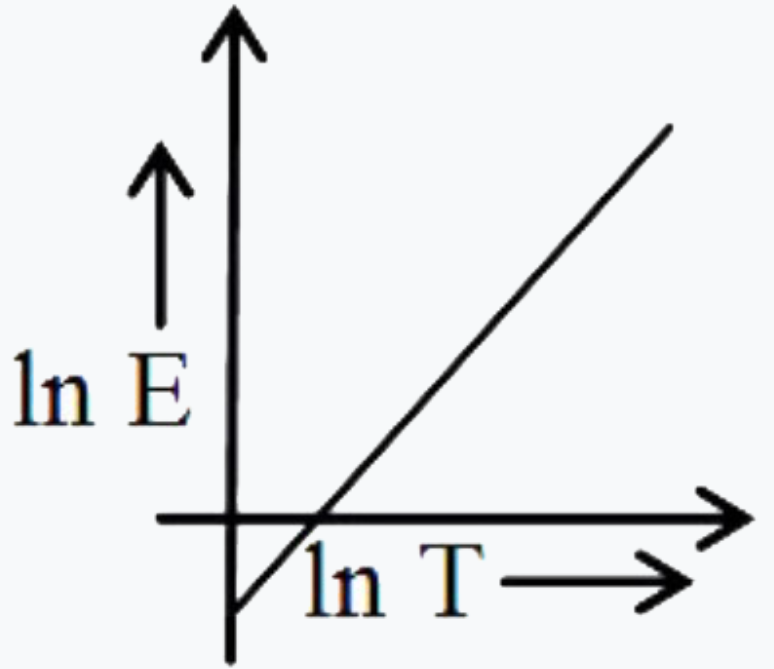
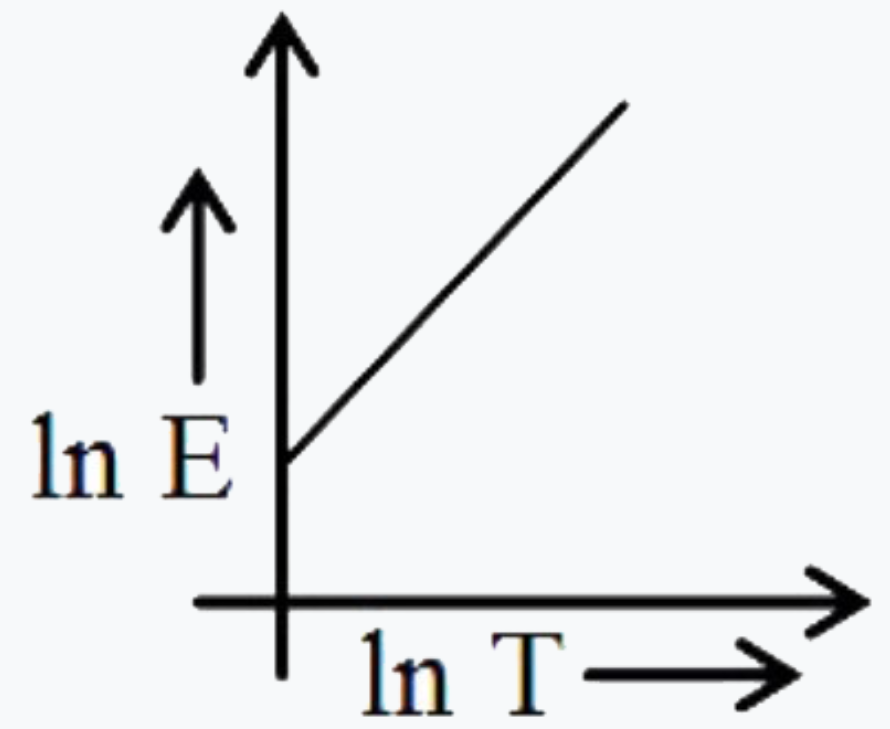
Home
Class 12
PHYSICS
Which of the following graphs correctly ...

Which of the following graphs correctly represents the relation between In (E) and In (T), where E is the amount of radiation emitted per unit time from a unit area of the body and T is the absolute temperature ?

A

B

C

D

Text Solution

AI Generated Solution

The correct Answer is:
To solve the problem, we need to establish the relationship between the amount of radiation emitted per unit time from a unit area of the body (E) and the absolute temperature (T). We will use Stefan-Boltzmann Law, which states that the power (P) emitted by a black body per unit area is proportional to the fourth power of its absolute temperature (T). ### Step-by-Step Solution: 1. **Understand the Stefan-Boltzmann Law**: The law states that: \[ P = \sigma A T^4 \] where \(P\) is the power emitted, \(A\) is the area, and \(\sigma\) is the Stefan-Boltzmann constant. 2. **Define E**: The amount of radiation emitted per unit time from a unit area (E) can be expressed as: \[ E = \frac{P}{A} \] Substituting the expression for \(P\): \[ E = \frac{\sigma A T^4}{A} = \sigma T^4 \] 3. **Take the Natural Logarithm**: To find the relationship in terms of natural logarithms, we take the natural logarithm of both sides: \[ \ln(E) = \ln(\sigma T^4) \] 4. **Apply Logarithmic Properties**: Using the properties of logarithms, we can expand the right side: \[ \ln(E) = \ln(\sigma) + \ln(T^4) = \ln(\sigma) + 4\ln(T) \] 5. **Rearranging the Equation**: We can rearrange this equation to match the form \(y = mx + c\): \[ \ln(E) = 4\ln(T) + \ln(\sigma) \] Here, \(y = \ln(E)\), \(x = \ln(T)\), the slope \(m = 4\), and the y-intercept \(c = \ln(\sigma)\). 6. **Analyze the y-intercept**: Since \(\sigma\) is a constant between 0 and 1, \(\ln(\sigma) < 0\). This means that the y-intercept is negative. 7. **Conclusion about the Graph**: The graph of \(\ln(E)\) versus \(\ln(T)\) will be a straight line with a slope of 4 and a negative y-intercept. ### Final Answer: The correct graph will be a straight line with a positive slope (4) and a negative y-intercept.
Promotional Banner

Similar Questions

Explore conceptually related problems

Which of the following series correctly represents relations between the elements from X to Y ? XtoY

Which of the following graph represents the variation of resistivity ( rho ) with temperature (T) for copper?

Which of the following graph correctly represents velocity-time relationship for a particle released from rest to fall freely under gravity ?

Which of the following x-t graphs represents the distance-time variation of a body released from the top of a buiding?

Which graph correctly represents variation between relaxation time (t) of gas molecules with absolute temperature of gas T.

Which graph correctly represents variation between relaxation time (t) of gas molecules with absolute temperature of gas T.

Which of the following is the graph between the height (h) of a projectile and time (t), when it is projected from the ground

A body is thrown vertically upwards. Which one of the following graphs correctly represent the velocity vs time?

Which one of the following is v_(m) - T graph for perfectly black body ? v_(m) is the frequency of radition with maximum intensity. T is the absolute temperature

The thermal radiation emitted by a body is proportional to T^(n) where T is its absolute temperature. The value of n is exactly 4 for