To solve the problem, we need to analyze the three phases of motion of the box and how the forces acting on it change during each phase. We will also consider the relationship between force, acceleration, and velocity.
### Step-by-Step Solution:
1. **Phase 1: Initial Hard Push**
- The boy applies a constant hard push (F1) on the box to get it moving.
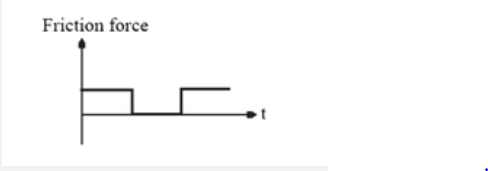
- The box experiences a frictional force (F_R) opposing the motion.
- The net force acting on the box can be expressed as:
\[
F_{\text{net1}} = F1 - F_R = m \cdot a_1
\]
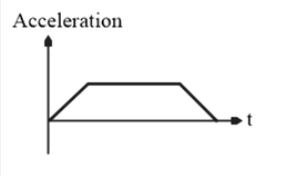
- Since the box starts from rest and accelerates, the acceleration (a1) is positive.
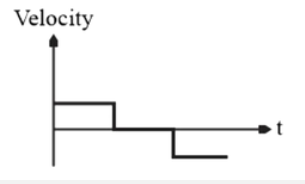
2. **Phase 2: Mild Push to Maintain Constant Velocity**
- In this phase, the boy applies a mild push (F2) to keep the box moving at a constant velocity.
- Since the velocity is constant, the acceleration is zero (a = 0).
- Therefore, the net force acting on the box is:
\[
F_{\text{net2}} = F2 - F_R = 0
\]
- This implies that the applied force (F2) is equal to the frictional force (F_R):
\[
F2 = F_R
\]
3. **Phase 3: Pulling Back to Stop the Box**
- The boy now applies a force (F3) in the opposite direction to bring the box to a stop with the same retardation.
- The frictional force (F_R) still opposes the motion.
- The net force during this phase can be expressed as:
\[
F_{\text{net3}} = F3 - F_R = -m \cdot a_2
\]
- Here, the acceleration (a2) is negative (retardation), indicating that the box is slowing down.
4. **Comparing Forces**
- From the first phase, we know that \( F1 > F_R \) (since it causes acceleration).
- From the second phase, \( F2 = F_R \).
- From the third phase, \( F3 < F_R \) (since it must overcome friction to decelerate the box).
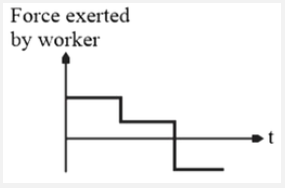
5. **Graph Representation**
- The graph representing the forces should show:
- A high value for F1 during the initial push,
- A lower value for F2 during constant velocity,
- An even lower value for F3 during the deceleration phase.
- The acceleration should be positive during the first phase, zero during the second phase, and negative during the third phase.
### Conclusion:
The correct graph will show:
- A peak for F1,
- A plateau for F2,
- A drop for F3,
- Corresponding changes in acceleration (positive, zero, negative).