A
B
C
D
Text Solution
Verified by Experts
The correct Answer is:


Similar Questions
Explore conceptually related problems
Recommended Questions
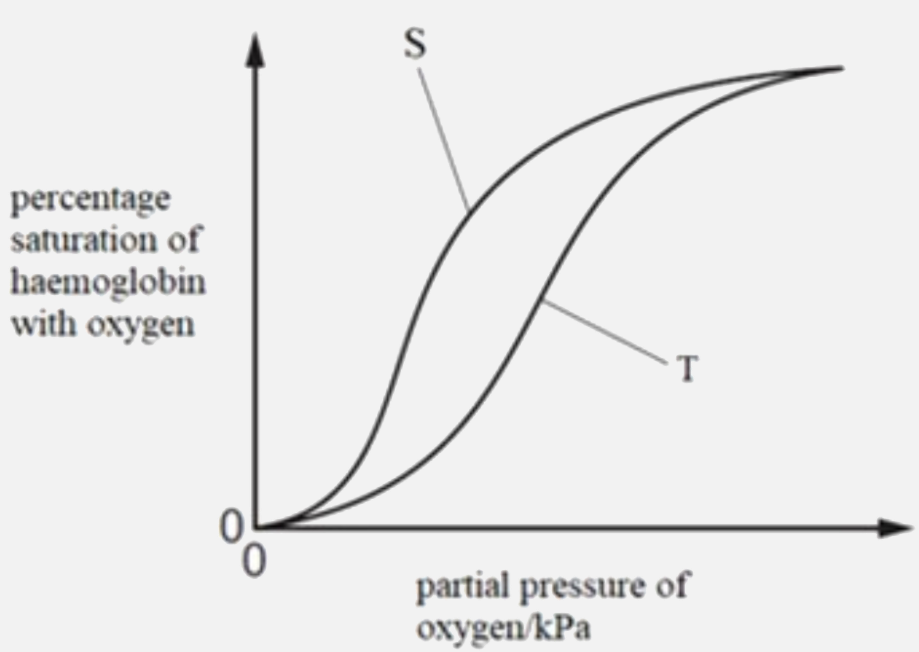
- The graph shows the oxygen dissociation curves of haemoglobin from two...
Text Solution
|
- Oxygen haemoglobin dissociation curve will shift to right on decrease ...
Text Solution
|
- At higher O(2) concentration, oxygen dissociation curve of haemoglobin...
Text Solution
|
- Oxygen dissociation curve of haemoglobin is
Text Solution
|
- The graph shows the oxygen dissociation curves of haemoglobin from two...
Text Solution
|
- Oxygen haemoglobin dissociation curve will shift to right on decrease ...
Text Solution
|
- What is the shape of oxygen dissociation curve of haemoglobin?
Text Solution
|
- In which conditon oxygen dissociation curve of haemoglobin shift to ri...
Text Solution
|
- Oxygen dissociation curve of haemoglobin is
Text Solution
|