A
B
C
D
Text Solution
Verified by Experts
The correct Answer is:


Similar Questions
Explore conceptually related problems
Recommended Questions
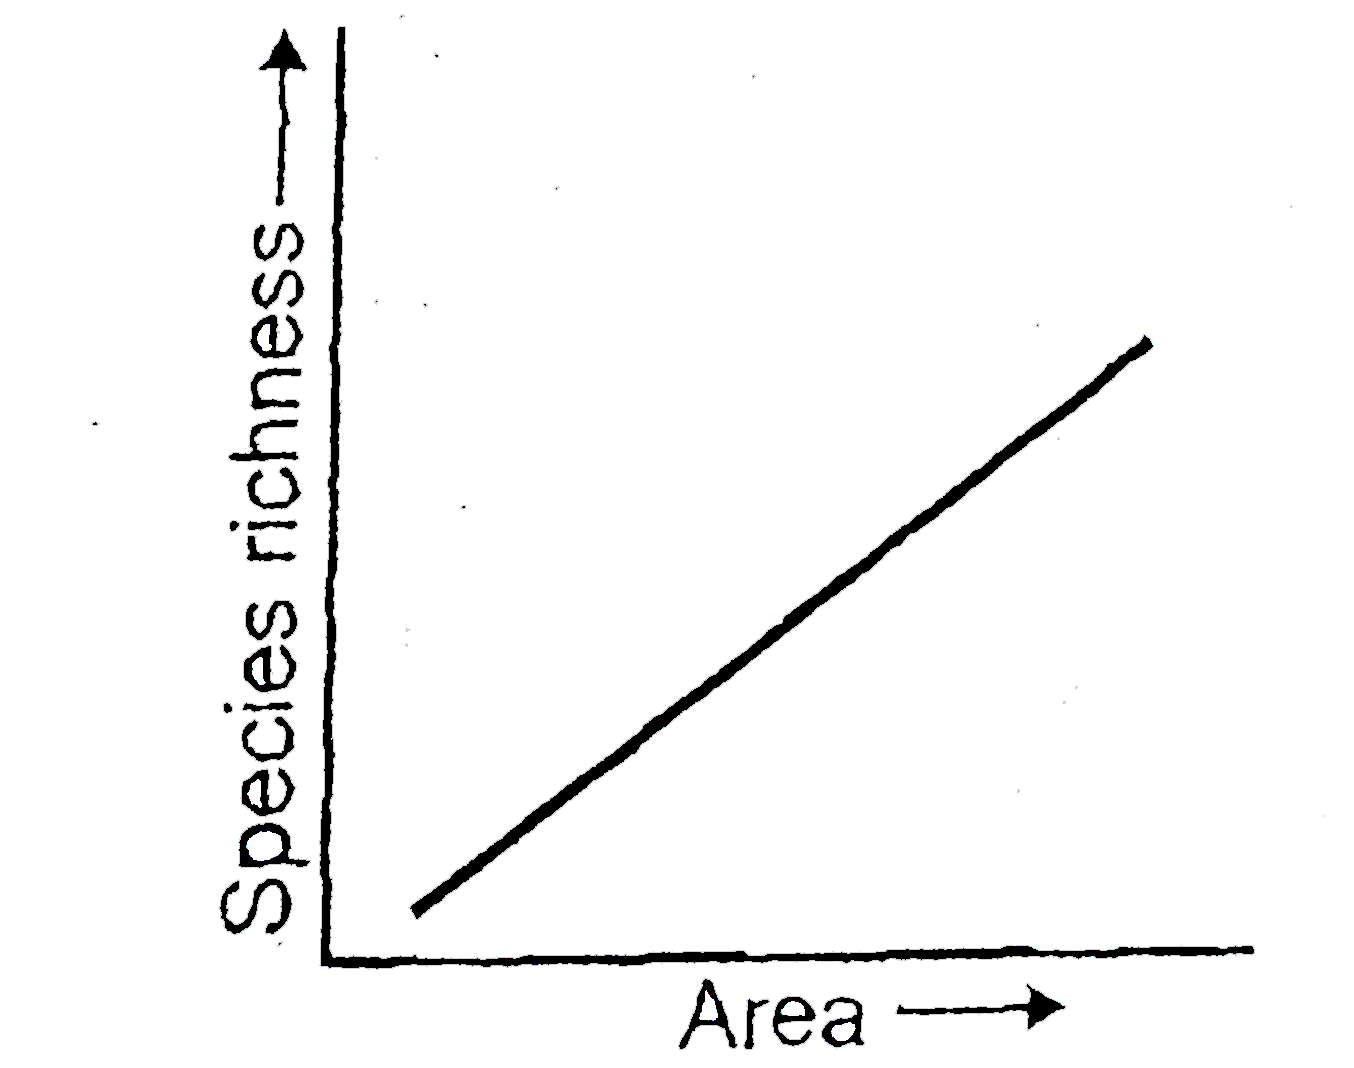
- Relationship between species richness (S) and area (A) represent in th...
Text Solution
|
- Which option correctly describes the equations for curves A and B, in ...
Text Solution
|
- The relation between specises richness and area is described on a loga...
Text Solution
|
- Which of the following equation correctly represent species-area relat...
Text Solution
|
- Relationship between species richness (S) and area (A) represent in th...
Text Solution
|
- Which option correctly describes the equation for curves A and B, in t...
Text Solution
|
- Select the correct linear equation describing the species area relatio...
Text Solution
|
- Which option correctly describes the equation for curves A and B, in t...
Text Solution
|
- Describe species area relationships.
Text Solution
|