A
B
C
D
Text Solution
Verified by Experts
The correct Answer is:


Similar Questions
Explore conceptually related problems
Recommended Questions
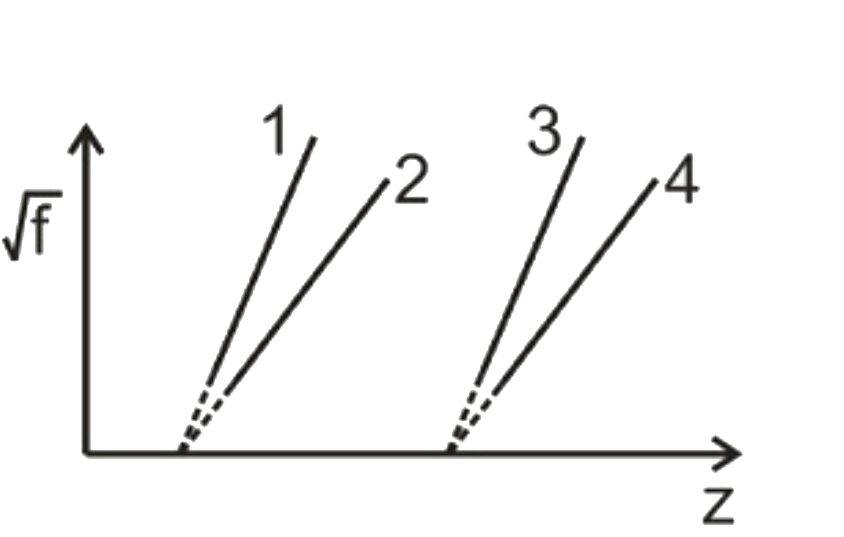
- The graph given below, shows the variation of sqrt(f) vs z for charac...
Text Solution
|
- Let lambda(alpha'), lambda(beta),and lambda'(alpha) denote the wavelen...
Text Solution
|
- If the frequency of K(alpha), K(beta) and L(alpha) , X-ray lines of a ...
Text Solution
|
- If lambda(K(alpha)), lambda(K(beta)) and lambda(L(alpha)) are the wave...
Text Solution
|
- sqrtv versus Z graph for characteristic X-rays is as shown in figure. ...
Text Solution
|
- If f(1)=f(2) and f(3) are the frequencies of corresponding K(alpha...
Text Solution
|
- The graph given below, shows the variation of sqrt(f) vs z for charac...
Text Solution
|
- किसी तत्व के X-किरण K(alpha), K(beta) व L(alpha) के सांगत आवृतियां f1 ...
Text Solution
|
- If lamda(K(alpha)),lamda(K(beta)) and lamda(L(alpha)) are the waveleng...
Text Solution
|