A
B
C
D
Text Solution
Verified by Experts
The correct Answer is:


Similar Questions
Explore conceptually related problems
Recommended Questions
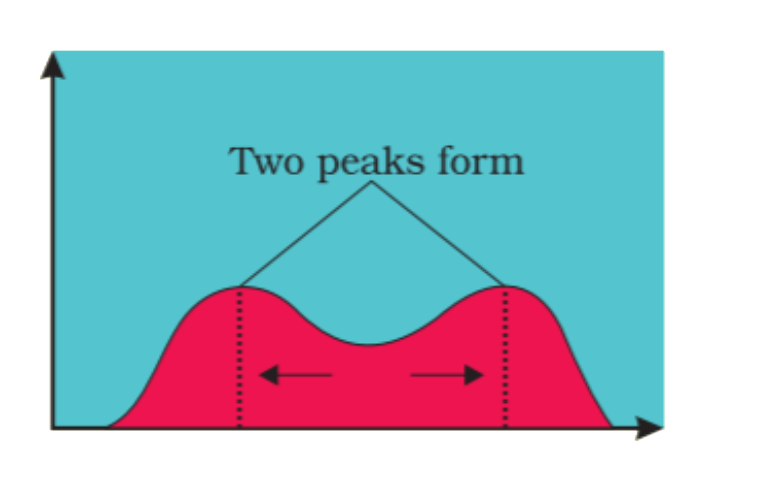
- In the diagram, the x-axis denotes the number of individuals with a ce...
Text Solution
|
- The phenotype of an individual:
Text Solution
|
- (a) Identify the mistakes (s) in the diagrams and give justification....
Text Solution
|
- In the diagram, the x-axis denotes the number of individuals with a ce...
Text Solution
|
- In the diagram, 'X' denotes…………………….
Text Solution
|
- In this diagram, X denotes
Text Solution
|
- In this diagram X denotes………….
Text Solution
|
- Name the structure that denotes 'X' in the given diagram.
Text Solution
|
- प्रतिरक्षी के लिए दिए गए आरेख में, 'X' को दर्शाता है
Text Solution
|