A
B
C
D
Text Solution
Verified by Experts
The correct Answer is:


Similar Questions
Explore conceptually related problems
Recommended Questions
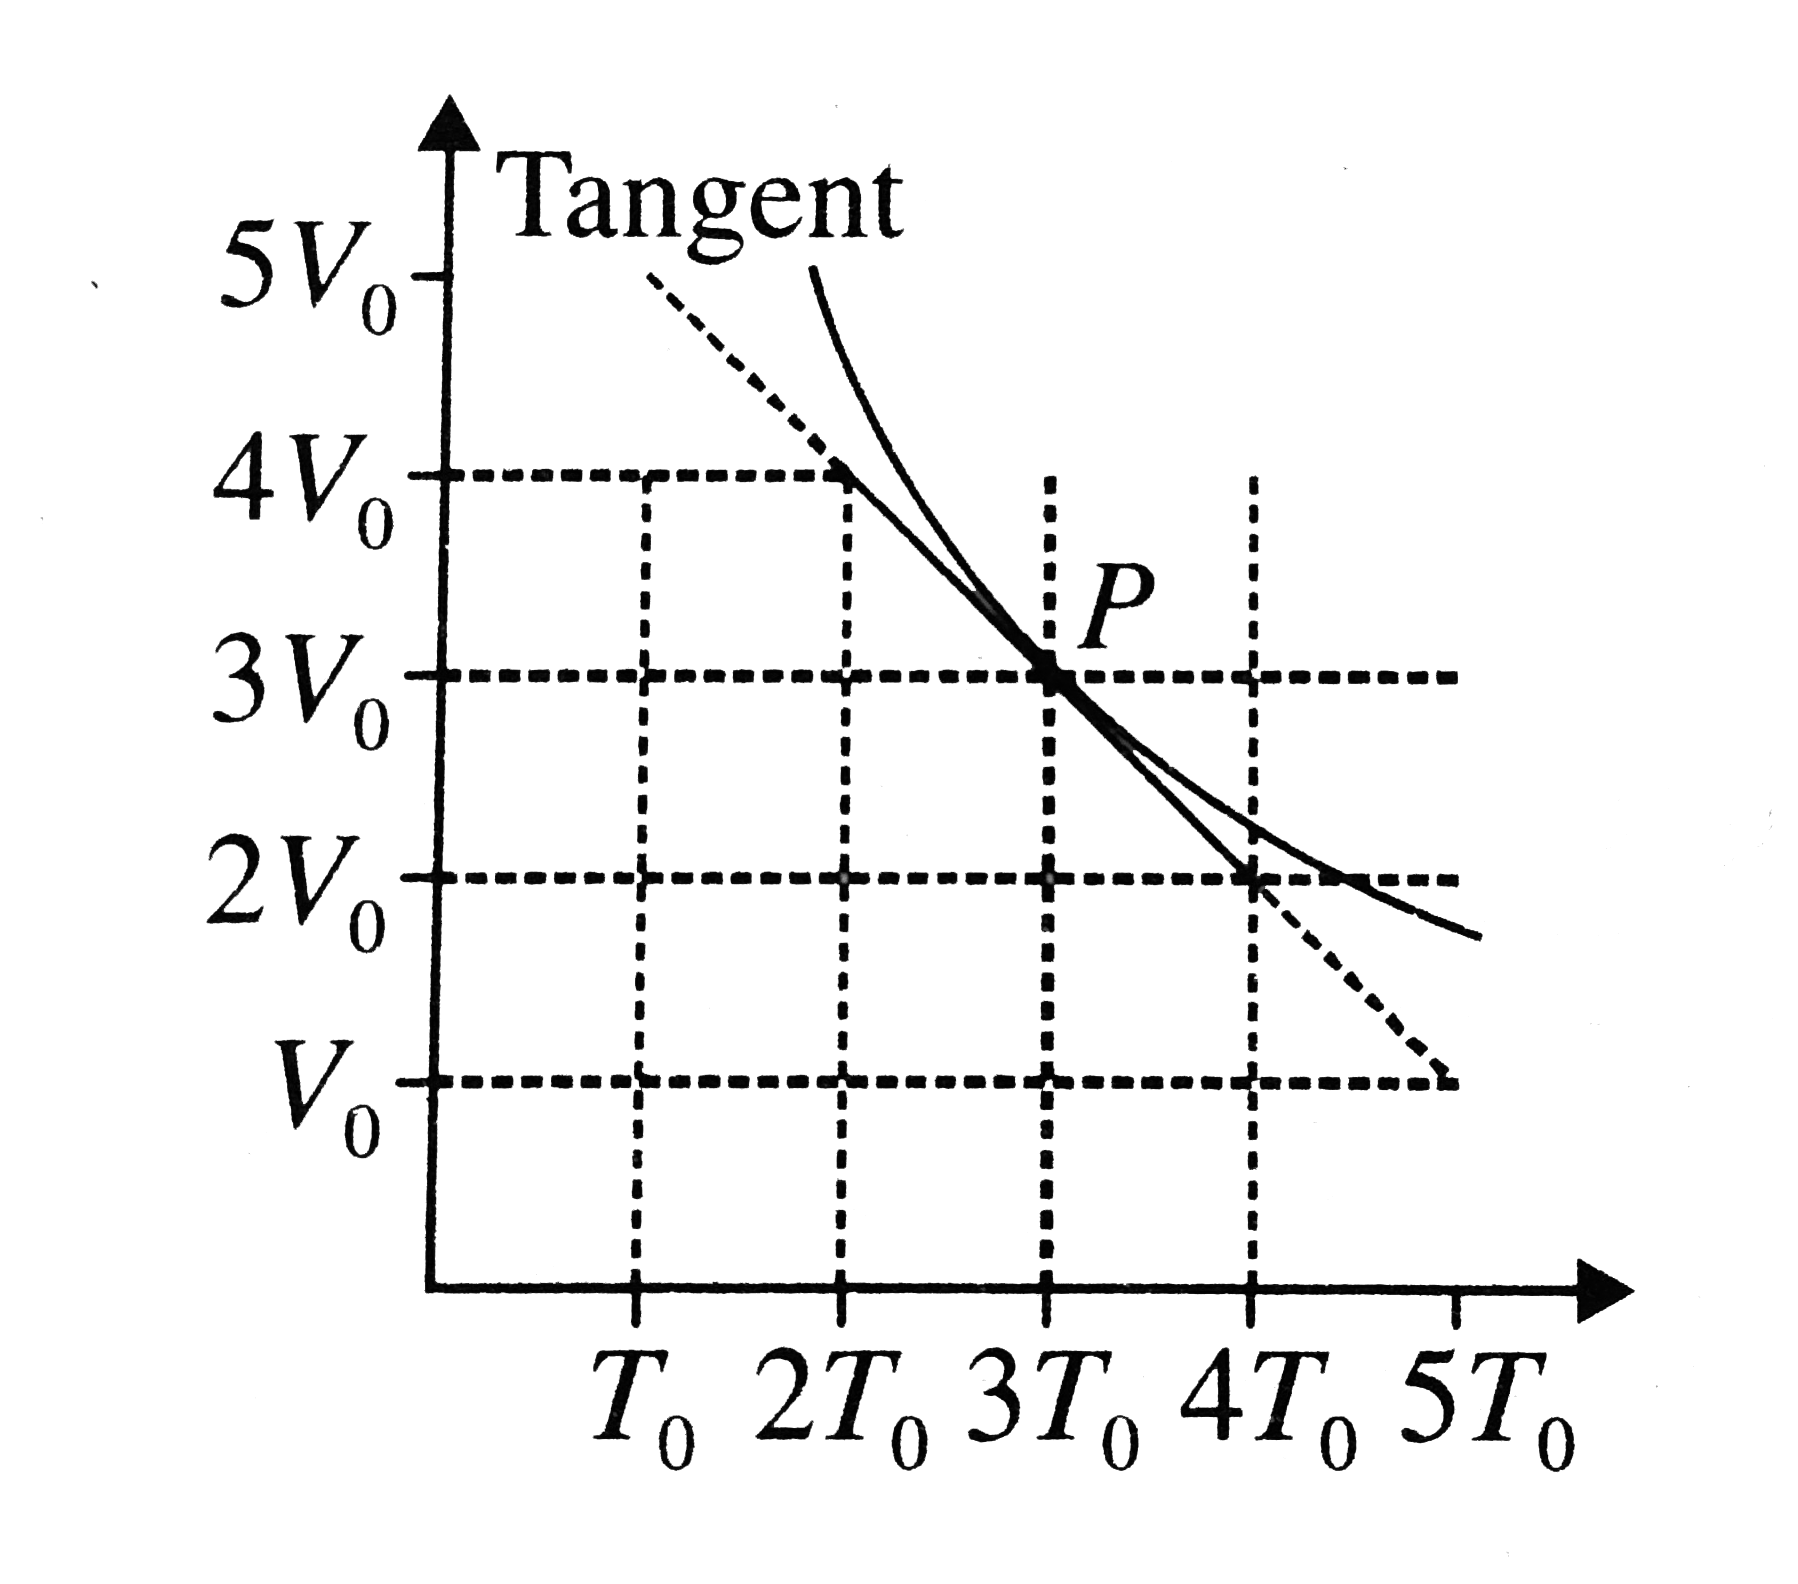
- Figure shows the adiabatic curve for n moles of an ideal gas, the bulk...
Text Solution
|
- Figure shows the adiabatic curve for n moles of an ideal gas, the bulk...
Text Solution
|
- The adiabatic Bulk modulus of a diatomic gas at atmosheric pressure is
Text Solution
|
- The bulk modulus of an ideal gas at constant temperature
Text Solution
|
- The isothermal Bulk modulus of an ideal gas at pressure P is
Text Solution
|
- The adiabatic Bulk modulus of a perfect gas at pressure is given by
Text Solution
|
- The bulk modulus of an ideal gas at constant temperature
Text Solution
|
- Figure shows, the adiabatic curve on a log T and log V scale performed...
Text Solution
|
- An ideal gas has adiabatic exponenty. It expands according to the law ...
Text Solution
|