A
B
C
D
Text Solution
Verified by Experts
The correct Answer is:


Similar Questions
Explore conceptually related problems
Recommended Questions
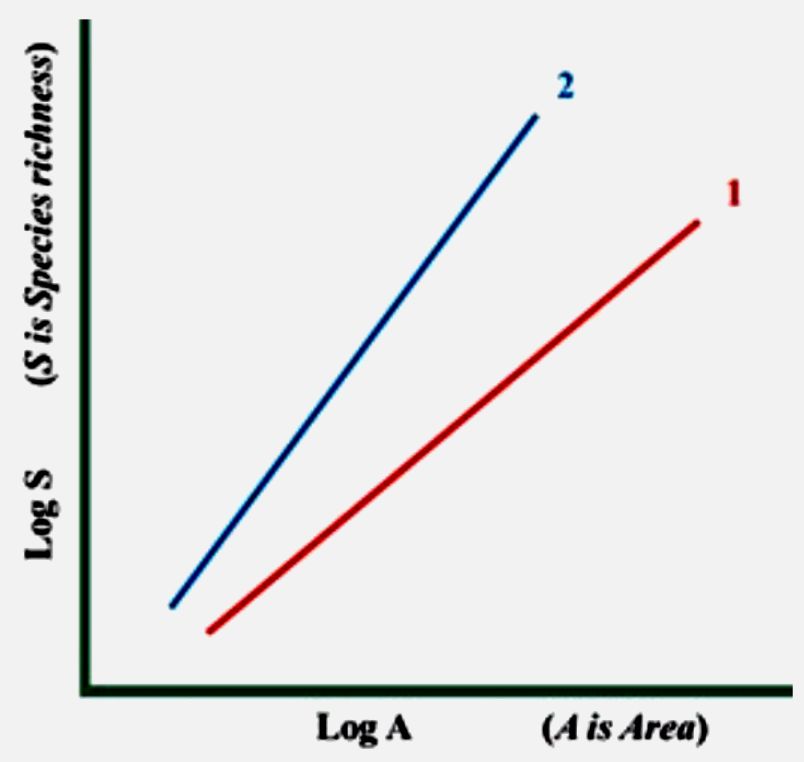
- Observe the graph of area versus species richness and select the optio...
Text Solution
|
- The graph between log k versus 1//T is a straight line.
Text Solution
|
- A graph of species richness vs area on log-log axes is
Text Solution
|
- The given graph shows species-area relationship. Write the equation of...
Text Solution
|
- The above graph show Species-Area relationship. Write the equation of ...
Text Solution
|
- Relationship between species richness (S) and area (A) represent in th...
Text Solution
|
- Observe the graph of area versus species richness and select the optio...
Text Solution
|
- Which of these examples will have the steepest curve when log of speci...
Text Solution
|
- The above graph show Species-Area relationship. Write the equation of ...
Text Solution
|