A
B
C
D
Text Solution
Verified by Experts
The correct Answer is:


Similar Questions
Explore conceptually related problems
Recommended Questions
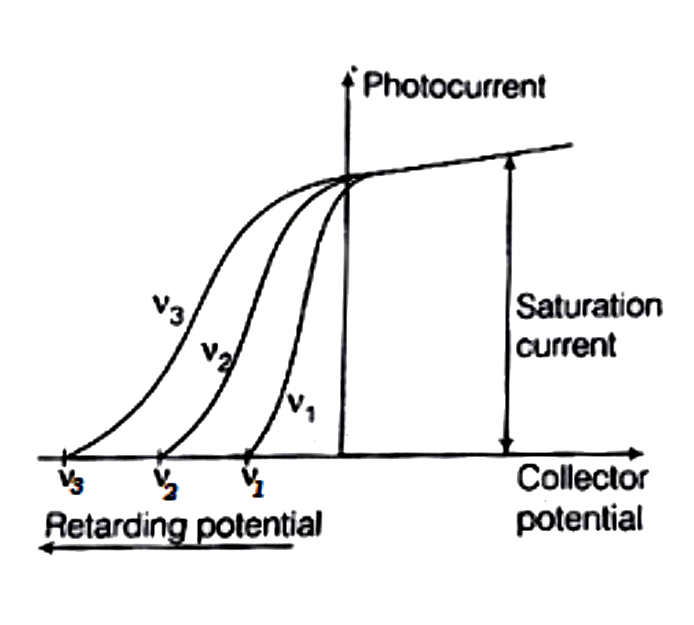
- The variation of photocurrent with collector potential for different f...
Text Solution
|
- Three voltmeters all having different resistance, are joined as shown....
Text Solution
|
- The graph of Fig. shows the variation of photoelectric current with co...
Text Solution
|
- The Fig shows a plot of three curves a, b, c showing the variation of ...
Text Solution
|
- Draw a plot showing the variation of photoelectric current with collec...
Text Solution
|
- The following graph shows the variation of photoelectric current for a...
Text Solution
|
- The frequency for a series limit of Balmer and paschen serial respecti...
Text Solution
|
- The variation of photocurrent with collector potential for different f...
Text Solution
|
- Discuss the variation of photocurrent with collector plate potential f...
Text Solution
|