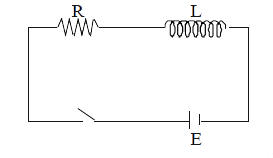
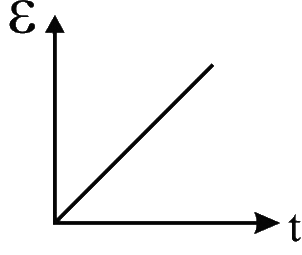
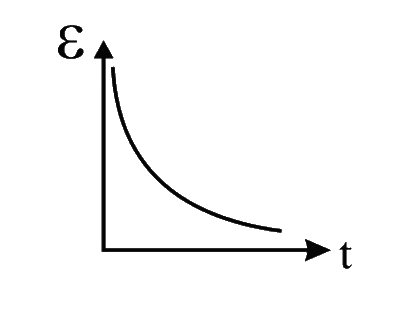
Home
Class 12
PHYSICS
Plot the variation of emf across the ind...

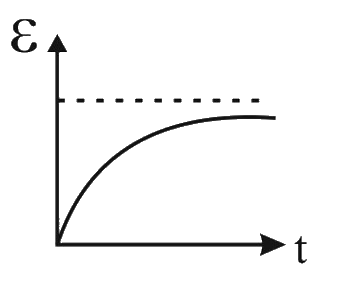
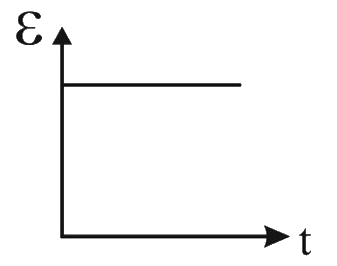
Plot the variation of emf across the inductor with respect time __

A

B

C

D

Text Solution

Verified by Experts

The correct Answer is:
C
Promotional Banner

Similar Questions

Explore conceptually related problems

Through a uniform B field, A small rectangular loop is moving towards left with constant velocity as shown in the figure. Counting of time t begins at the moment, the loop starts entering the field. Plot the variation of flux through the loop with respect to time. Also, plot the variation of induced emf w.r.t. time t.

The figure shows the graphical variation of the reactance of a capacitor with frequency of ac source. (a) find the capacitance of the capacitor (b)an ideal inductor has the same reactance at 100 Hz frequency as the capacitor has the same frequency find the value of the inductor. (c) draw the graph showing the variation of the reactance of this inductor with frequency

The current through two inductors of self inductance 12 mH and 30 mH is increasing with time at the same rate. Draw graphs showing the variation of the (a ) e.m.f. induced with the rate of change of current in each inductor. (b) enargy stored in each inductor with the current flowing through it. Compare the energy stored in the coils if power dissipated in the coil is same.

Plots showing the variation of the rate constant (k) with temperature (T) are given below. The plot that follows the Arrhenius equation is

The current I in an inductance coil varies with time according to the graph given in the figure. Which one of the following graphs gives the variation of voltage with time across the inductor?

In an L-R circuit connected to a battery of constant emf E, switch is closed at time t=0. If e denotes the induced emf across inductor and I the current in the circuit at any time t. Then which of the following graphs shown the variation of e with i?

The given plots represent the variation of the concentration of a reactant R with time for different reactions (i) and (ii). The respective orders of the reactions are:

A 1 -k Omega resistor is connected in series with a 10-mH inductor, a 30 V battery and an open switch. At time t= 0 , the switch is suddenly closed. a. What is the maximum current in this circuit and when does it occur? b. What are the voltage drops across the inductor and across the resistor 20 mu s after the switch is closed? c. On a single set of axes, sketch the voltage across the resistor and the voltage across the inductor as functions of time. Also, sketch a graph of the current in the circuit as s function of time.

The given plots represent the variation of the concentration of a reactant R with time for different reactions (i) and (ii). The sum of orders of the reactions is ________ .

A 1.00 mH inductor and a 1.00muF capacitor are connected in series. The current in the circuit is described by i = 20 t , where t, is in second and i is in ampere. The capacitor initially has no charge. Determine (a) the voltage across the inductor as a function of time, (b) the voltage across the capacitor as a function of time, (c) the time when the energy stored in the capacitor first exceeds that in the inductor.