A
B

C
D
Text Solution
AI Generated Solution
The correct Answer is:


Similar Questions
Explore conceptually related problems
Recommended Questions
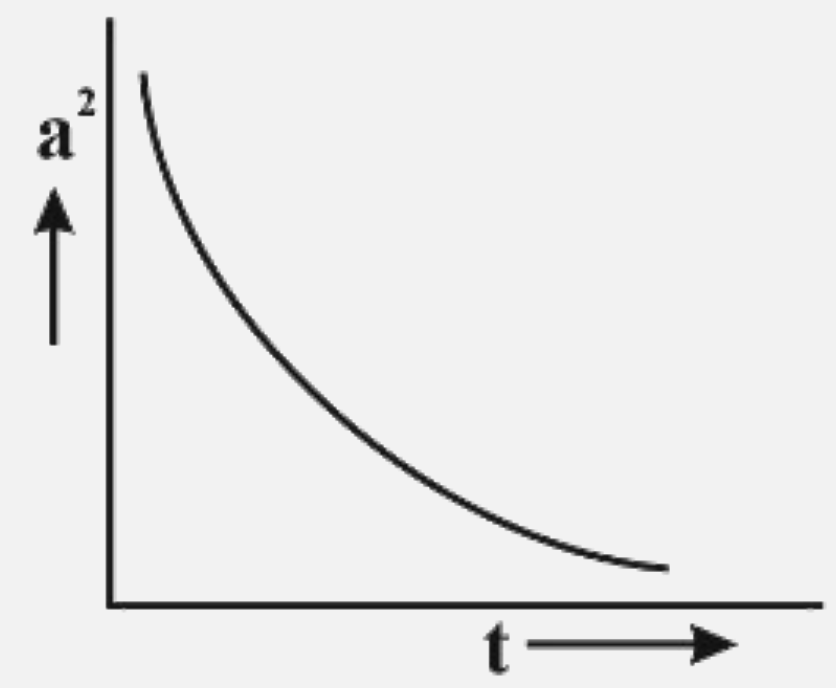
- In an experiment , to find the loss of energy with respect to time in ...
Text Solution
|
- For a simple pendulum the graph between length and time period will be
Text Solution
|
- To study the dissipations of the energy of a simple pendulum, student ...
Text Solution
|
- For a simple pendulum the graph between length and time period will be
Text Solution
|
- In the case of a simple pendulum, a graph is drawn between the displac...
Text Solution
|
- To study the dissipations of the energy of a simple pendulum, student ...
Text Solution
|
- In an experiment , to find the loss of energy with respect to time in ...
Text Solution
|
- The graph between the time period and the length of a simple pendulum ...
Text Solution
|
- In an experiment , to find the loss of energy with respect to time in ...
Text Solution
|