A
B
C
D
Text Solution
AI Generated Solution
The correct Answer is:


Similar Questions
Explore conceptually related problems
Recommended Questions
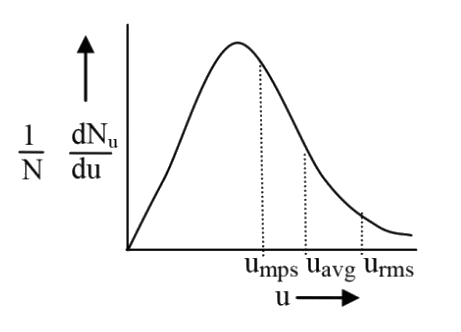
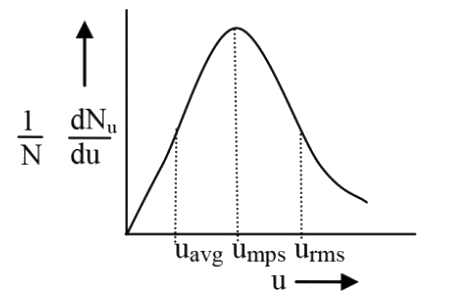
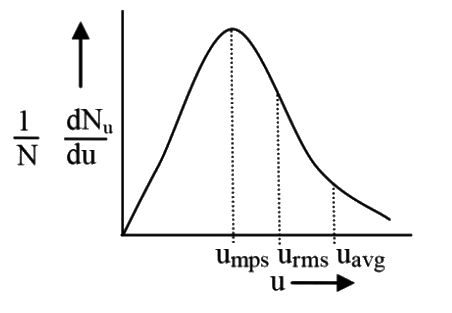
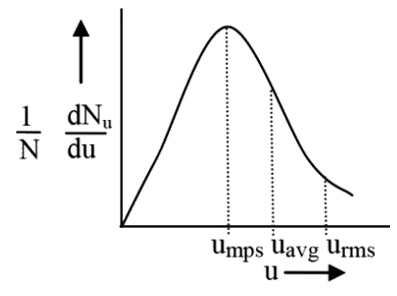
- Which of the following plot is correct about Maxwell's speed distribut...
Text Solution
|
- Assertion: All molecules in a gas are moving with same speed. Reason...
Text Solution
|
- Consider the following statement regarding Maxwell's distribution of s...
Text Solution
|
- Plot of Maxwell's distribution of velocities is given below: which of ...
Text Solution
|
- Which of the following plot is correct about Maxwell's speed distribut...
Text Solution
|
- The effect of temperature on Maxwell's speed distribution is correctly...
Text Solution
|
- Select the incorrect statement about Maxwell's speed distribution.
Text Solution
|
- Plot of Maxwell's distribution of velocities is given below : Which of...
Text Solution
|
- Plat of Maxwell.s distribution of velocities is gives below : W...
Text Solution
|