A
B
C
D
Text Solution
Verified by Experts
The correct Answer is:


Similar Questions
Explore conceptually related problems
Recommended Questions
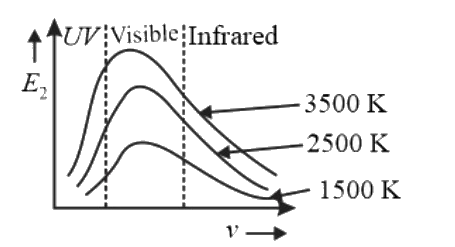
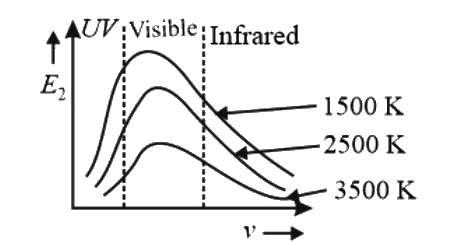
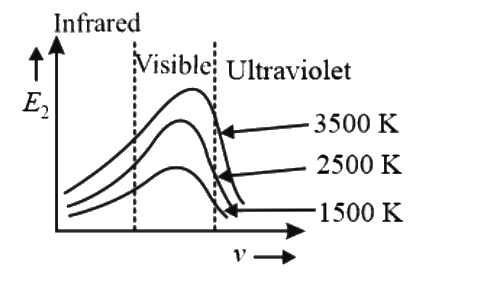
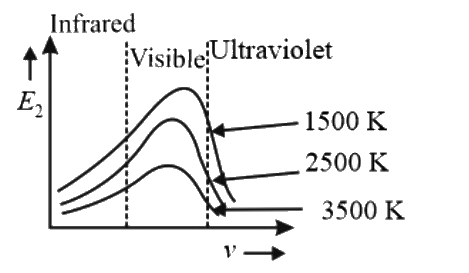
- Following graphs shows the variation in the intensity of heat radiatio...
Text Solution
|
- A heated body emits radiation which has maximum intensity at frequency...
Text Solution
|
- Which of the following graphs shows the correct variation in intensity...
Text Solution
|
- The shows a radiant energy spectrum graph for a black body at at tempe...
Text Solution
|
- The shows a radiant energy spectrum graph for a black body at at tempe...
Text Solution
|
- Following graph shows the correct variation in intensity of heat radia...
Text Solution
|
- Following graphs shows the variation in the intensity of heat radiatio...
Text Solution
|
- Darw graphs showing variation of photoelctric current with applied ...
Text Solution
|
- Draw graphs showing variation of photoelectric current with applied vo...
Text Solution
|