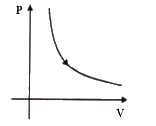
A
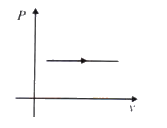
B
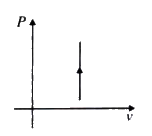
C
D
Text Solution
Verified by Experts
The correct Answer is:


Similar Questions
Explore conceptually related problems
Recommended Questions
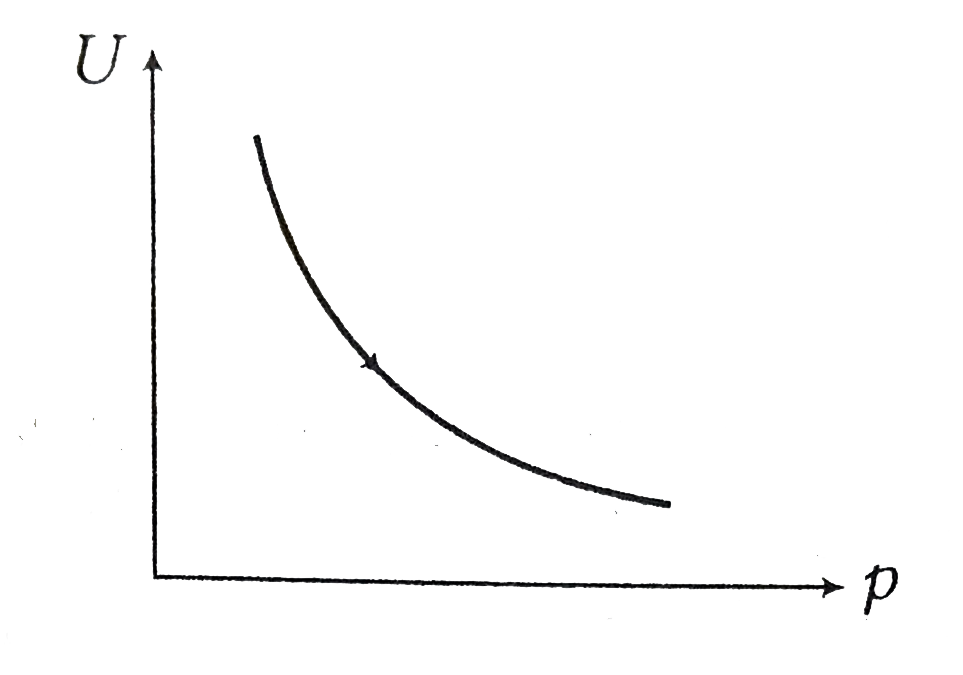
- Vairation of internal energy with density of one mole of monoatomic ga...
Text Solution
|
- One mole of an ideal monoatomic gas is taken at a temperature of 300 K...
Text Solution
|
- Variation of internal energy with density of 1 "mole" of monatomic gas...
Text Solution
|
- The given curve represents the variation of temperature as a function ...
Text Solution
|
- The variation of internal energy U and density d of one mole of an ide...
Text Solution
|
- Figure shows the variations of the internal energy U With density rho ...
Text Solution
|
- Figure shows the variation of the internal energy U with the density r...
Text Solution
|
- One mole of an ideal monoatomic gas is taken at a temperature of 300 K...
Text Solution
|
- The given curve represents the variation of temperatue as a function o...
Text Solution
|