A
B
C
D
Text Solution
Verified by Experts
The correct Answer is:


Similar Questions
Explore conceptually related problems
Recommended Questions
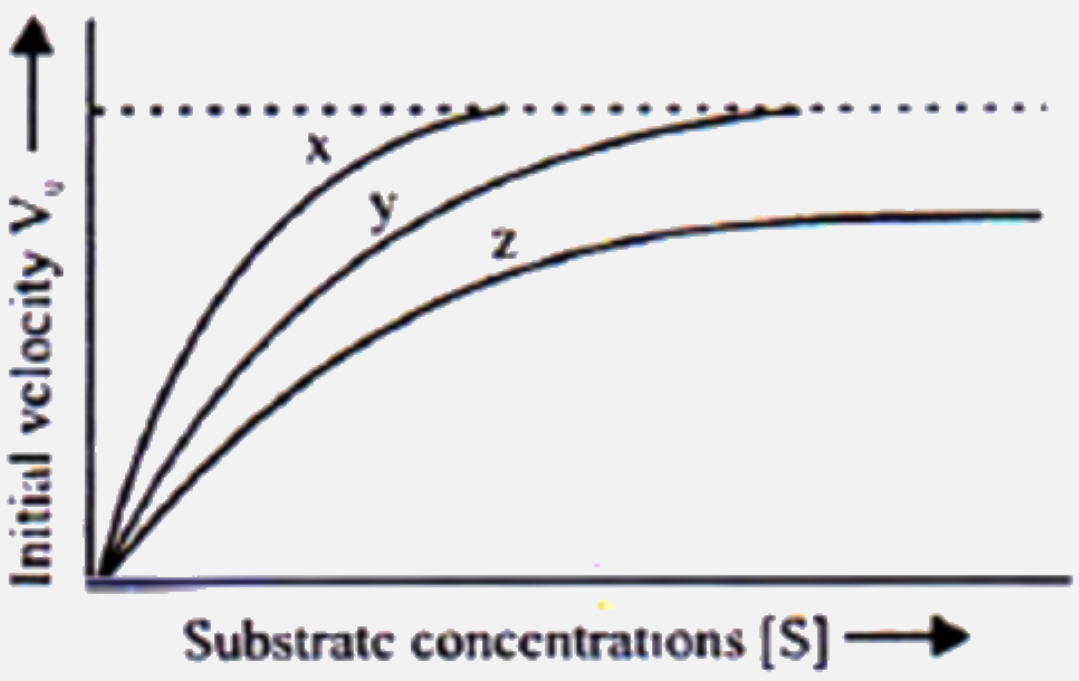
- The Given figure shows three velocity-substrate concentration curves ...
Text Solution
|
- Figure given below shows three velocity-substrate concentration curves...
Text Solution
|
- the curve given below shows wnzymatic acitvity with relation ...
Text Solution
|
- The curve given below shows enzymatic activity with relation to three ...
Text Solution
|
- The Given figure shows three velocity-substrate concentration curves o...
Text Solution
|
- Three velocity base concentrations are given in the figure below for a...
Text Solution
|
- नीचे दिखाये गये वक्र में तीन दशाओं (pH, तापमान तथा क्रियाधार सांद्रण) ...
Text Solution
|
- The curve given below show enzymatic activity with relation to three c...
Text Solution
|
- the curve given below shows wnzymatic acitvity with relation ...
Text Solution
|