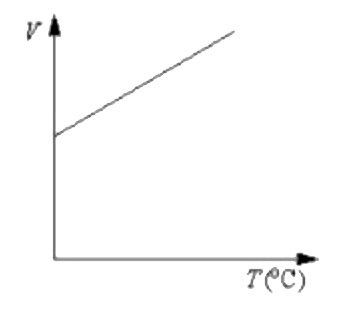
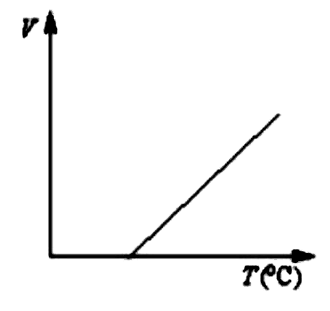
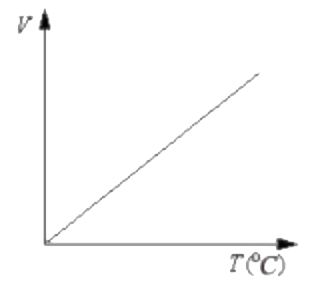
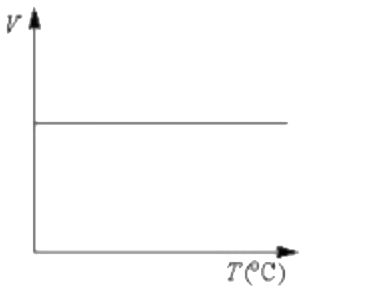
Home
Class 12
PHYSICS
Volume - temperature graph at atmospheri...

Volume - temperature graph at atmospheric pressure for a monatomic gas ( V in `m^3` , T in Celsius ) is

A

B

C

D

Text Solution

AI Generated Solution

The correct Answer is:
To solve the problem of determining the volume-temperature graph for a monatomic gas at atmospheric pressure, we can follow these steps: ### Step-by-Step Solution: 1. **Understand the Ideal Gas Law**: The ideal gas law is given by the equation: \[ PV = nRT \] where \( P \) is the pressure, \( V \) is the volume, \( n \) is the number of moles, \( R \) is the gas constant, and \( T \) is the absolute temperature in Kelvin. 2. **Convert Temperature to Celsius**: Since the temperature is given in Celsius, we need to convert it to Kelvin. The conversion is: \[ T(K) = T(°C) + 273 \] 3. **Rearrange the Ideal Gas Law**: We need to express volume \( V \) in terms of temperature \( T \): \[ V = \frac{nR}{P} T \] Substituting \( T \) with \( (T(°C) + 273) \): \[ V = \frac{nR}{P} (T(°C) + 273) \] 4. **Identify the Linear Equation**: The equation can be rewritten in the form of \( y = mx + c \): \[ V = \frac{nR}{P} T(°C) + \frac{nR \cdot 273}{P} \] Here, \( y \) is \( V \), \( x \) is \( T(°C) \), \( m = \frac{nR}{P} \) (the slope), and \( c = \frac{nR \cdot 273}{P} \) (the y-intercept). 5. **Determine the Characteristics of the Graph**: - The slope \( m \) is positive since \( n \), \( R \), and \( P \) are all positive. - The y-intercept \( c \) is positive because it is a product of positive constants and 273. 6. **Analyze the Options**: Based on the characteristics of the graph: - The graph should have a positive slope and a positive y-intercept. 7. **Conclusion**: The correct graph for the volume-temperature relationship of a monatomic gas at atmospheric pressure is the one that shows a straight line with a positive slope and a positive intercept.
Promotional Banner

Similar Questions

Explore conceptually related problems

At a given volume and temperature the pressure of a gas

Figure shows volume - temperature (V-T) graph for same mass of an ideal gas at two different pressures P_1 and P_2 . Hence

Volume occupied by an ideal gas at one atmospheric pressure and 0^@C is V ml. Its volume at 273 K will be

A certain amount of a gas at 27^(@)C and 1 atmospheric pressure occupies a volume of 25dm^(3) . If the pressure is kept constant and the temperature is raised to 77^(@)C , what would be the volume of the gas ?

The volume-temperature graphs of a given mass of an ideal gas at constant pressure are shown below. What is the correct order of pressure ?

A plot of volume (V) versus temperature (T) for a gas at constant pressure is a straight line passing through the origin. The plots at different values of pressure are shown in figure. Which of the following order of pressure is correct for this gas ?

A plot of volume (V) versus temperature (T) for a gas at constannt pressure is a straight line passing through the origin. The plots at different values of pressure are shown in figure. Which of the following order of pressure is correct for this gas?

A plot of volume (V) versus temperature (T) for a gas at constant pressure is a straight line passing through the origin . The plots at different values of pressure are shown in figure . Which of the following order of pressure is correct for this gas ?

Unit mass of liquid of volume V_(1) completely turns into a gas of volume V_(2) at constant atmospheric pressure P and temperature T. The latent heat of vaporization is "L". Then the change in internal energy of the gas is

The pressure P, Volume V and temperature T of a gas in the jar A and the other gas in the jar B at pressure 2P , volume V//4 and temperature 2 T , then the ratio of the number of molecules in the jar A and B will be