A
B
C
D
Text Solution
AI Generated Solution
The correct Answer is:


Similar Questions
Explore conceptually related problems
Recommended Questions
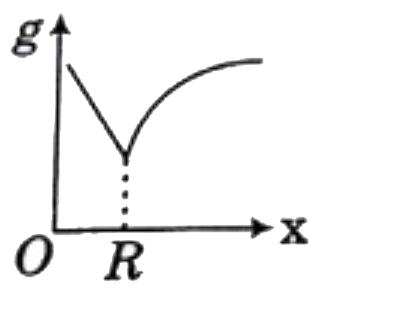
- Which graph correctley presents the variation of acceleration due to g...
Text Solution
|
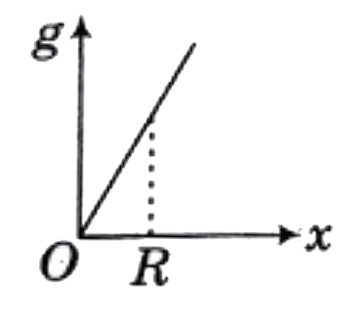
- Which graph correctly presents the variation of acceleration due to gr...
Text Solution
|
- Assertion: A body becomes weightless at the centre of earth. Reason: A...
Text Solution
|
- If R= radius of the earth and g= acceleration due to gravity on the su...
Text Solution
|
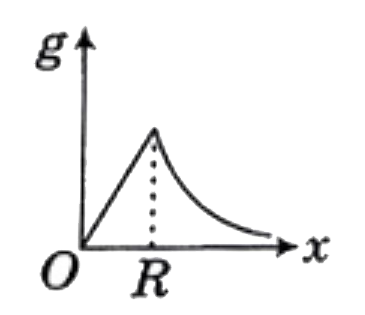
- If earth is assumed to be a sphere of uniform density then plot a grap...
Text Solution
|
- Acceleration due to gravity at the centre of the earth is :-
Text Solution
|
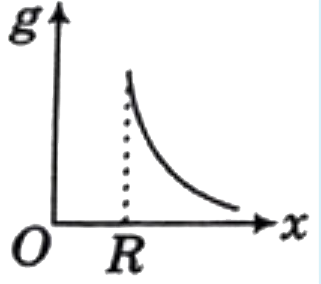
- Variation of acceleration due to gravity (g) with distance x from the ...
Text Solution
|
- The variation of acceleration due to gravity g with distance d from ce...
Text Solution
|
- Variation of acceleration due to gravity (g) with distance x from the ...
Text Solution
|