A
B
C
D
Text Solution
Verified by Experts
The correct Answer is:


Similar Questions
Explore conceptually related problems
Recommended Questions
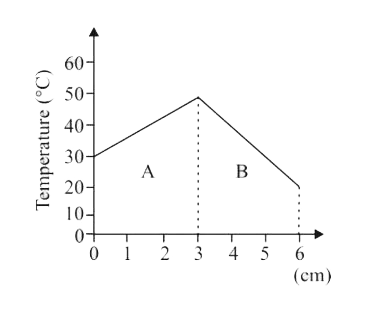
- The temperatures across two different slabs A and B are shown in the s...
Text Solution
|
- Find the rate of heat flow through a cross section of the rod shown in...
Text Solution
|
- The temperature across two different slabs A and B are shown I the ste...
Text Solution
|
- A rod of 1m length and area of cross-section 1cm^(2) is connected acro...
Text Solution
|
- Two conducting rods A and B of same length and cross-sectional area ar...
Text Solution
|
- Two similar rods are joined as shown in figure. Then temperature of ju...
Text Solution
|
- Two different rods A and B are kept as shown in figure . The variation...
Text Solution
|
- Two rods P and Q of equal lengths have thermal conductivities K(1) and...
Text Solution
|
- A rod of 1 m length and area of cross-section 1 cm^2 is connected acr...
Text Solution
|