A
B
C
D
Text Solution
Verified by Experts
The correct Answer is:


Similar Questions
Explore conceptually related problems
Recommended Questions
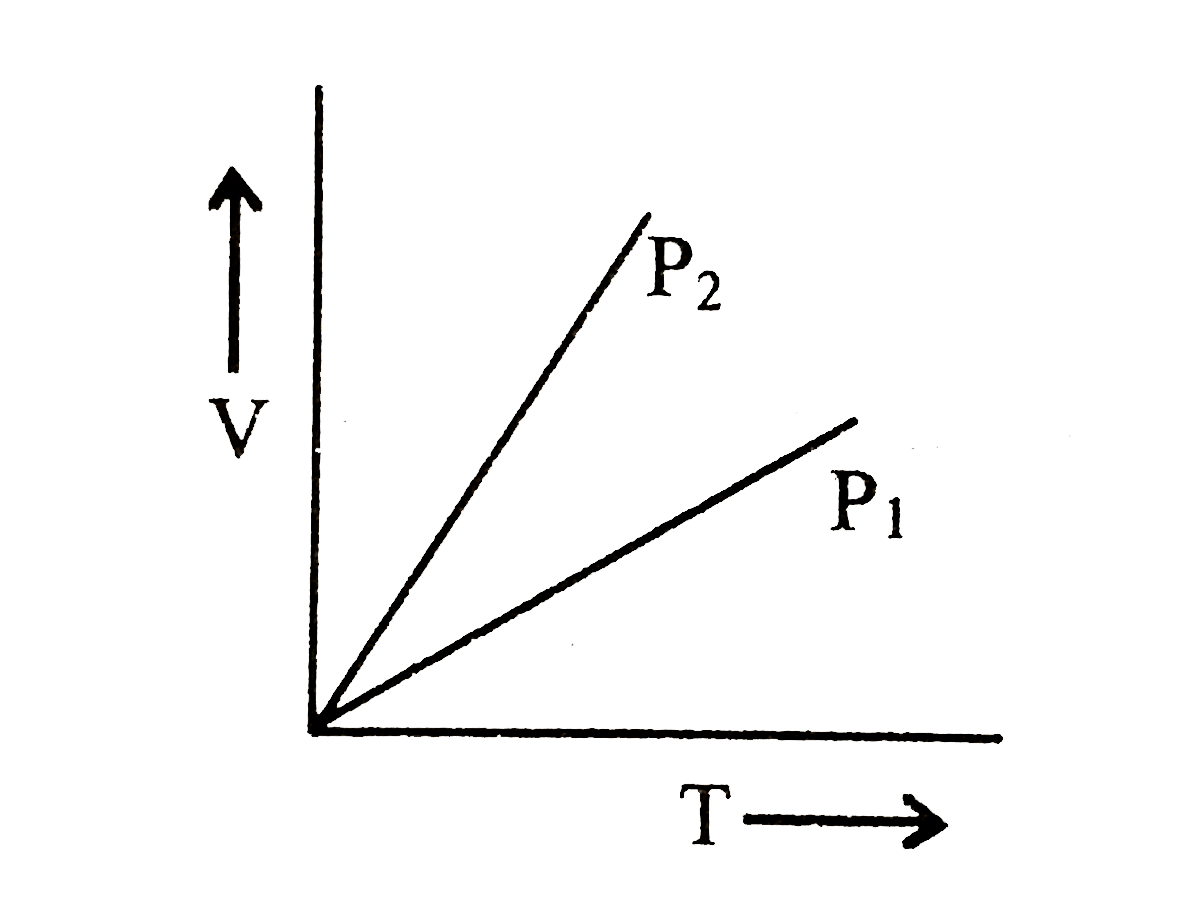
- For V versus T curves at constant pressure P1 and P2 for and ideal gas...
Text Solution
|
- The volume V versus temperature T graphs for a cetain amount of a perf...
Text Solution
|
- For an ideal gas V - T curves at constant pressure P(1) & P(2) are sho...
Text Solution
|
- For V versus T curves at constant pressure P1 and P2 for and ideal gas...
Text Solution
|
- Pressure versus density graph of an ideal gas is shown in figure
Text Solution
|
- V vs T curves at constant pressure P(1) and P(2) for an ideal gas are ...
Text Solution
|
- Figure 6.18 shows the V-T graph for a fixed mass of an ideal gas at pr...
Text Solution
|
- For an ideal gas V - T curves at constant pressure P(1) & P(2) are sho...
Text Solution
|
- For an ideal gas V-T curves as constant pressures P1 & P2 are shown in...
Text Solution
|