A
B
C
D
Text Solution
Verified by Experts
The correct Answer is:


Similar Questions
Explore conceptually related problems
Recommended Questions
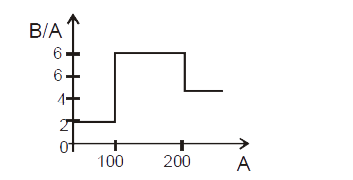
- Assume that the nuclear binding energy per nucleon (B/A) versus mass n...
Text Solution
|
- Assume that the nucles binding energy per nucleus (B//A) versus mass ...
Text Solution
|
- Assume that the nuclear binding energy per nucleon (B//A) versus mass ...
Text Solution
|
- Assume that the nuclear binding energy per uncleon (B//A) versus mass ...
Text Solution
|
- Binding energy per nucleon plot against the mass number for stable nuc...
Text Solution
|
- Assume that the nuclear binding energy per nucleon (B/A) versus mass n...
Text Solution
|
- VARIATION OF BINDING ENERGY OF PER NUCLEON WITH MASS NUMBER
Text Solution
|
- Explain the process of nuclear fission and nuclear fussion by using th...
Text Solution
|
- Assume that the nuclear binding energy per nucleon (BIA) versus mass n...
Text Solution
|