A
B
C
D
Text Solution
AI Generated Solution
The correct Answer is:


Similar Questions
Explore conceptually related problems
Recommended Questions
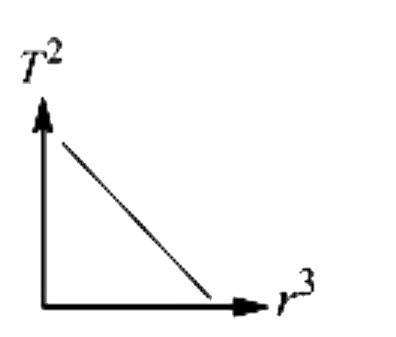
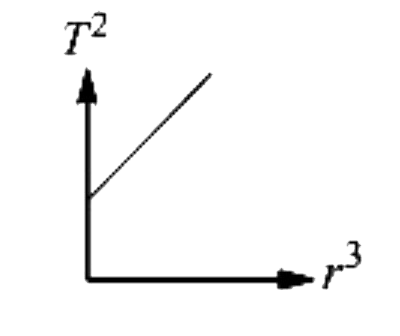
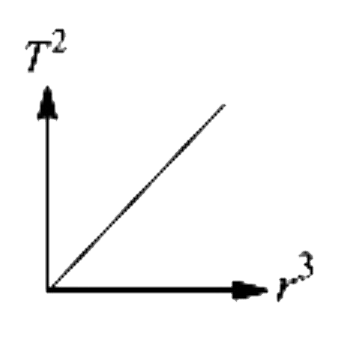
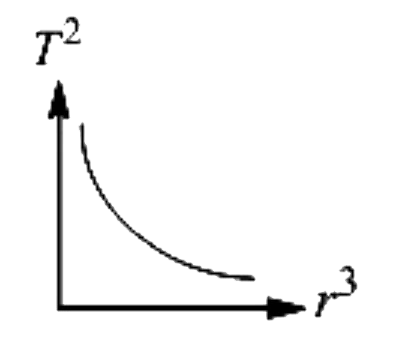
- Which of the following graphs between the square of the time period an...
Text Solution
|
- Which of the following graphs represents the motion of the planet movi...
Text Solution
|
- If a and b are the nearest and farthest distances of a planet from the...
Text Solution
|
- The distance of a planet from the sun is 5 times the distance between ...
Text Solution
|
- Which of the following graphs between the square of the time period an...
Text Solution
|
- The period of revolution of a planet around the sun is 8 times that of...
Text Solution
|
- किसी ग्रह एवं सूर्य के बीच की दुरी, सूर्य तथा पृथ्वी के बीच की दुरी की...
Text Solution
|
- The time period of revolution of a planet A around the sun is 8 times ...
Text Solution
|
- The time period of revolution of a planet A around the sun is 8 times ...
Text Solution
|